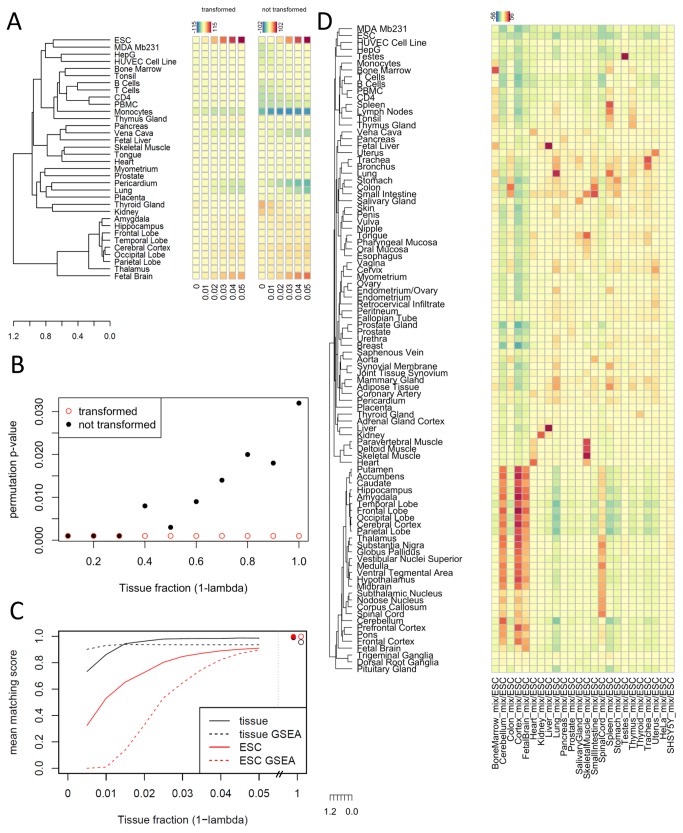
Figure 3. Performance evaluations with simulated data.
(A) In the case of relatively high heterogeneity and comparably low signal strength, the spherical transformation increases sensitivity and specificity of the simulated effect, i.e. results in a strong and specific increase of the ESC score (left part). The results without spherical transformation (right part) are more heterogeneous. (B) The null-distribution obtained from re-sampling without spherical transformation is not meaningful in cases of high signal strength and low heterogeneity, leading to increasing p-values for increasing signal strength in simulated data. This effect does not occur when the spherical transformation is applied. Depicted are permutation p-values for the lung signature with (red dots) and without (black dots) spherical transformation. (C) The mean matching score of 21 simulated mixtures is compared between the implemented PhysioSpace algorithm and a classical GSEA based method. The matching score is defined as the quotient of the respective tissue (or ESC) score and the highest (lowest) score. It is truncated at a minimum of zero, avoiding negative values. While there are some differences between the two methods, especially for very low mixture values, the overall performance does not generally favor one or the other algorithm. (D) The PhysioScores of simulated mixtures of 97% ESCs with 3% of different tissues are visualized as an exemplary case, showing a very nice agreement with biological expectations. Correlations between different signatures are represented by the dendrogram on the left hand side as well as by simultaneous increasing PhysioScores in the columns of the heatmap-like representation.

