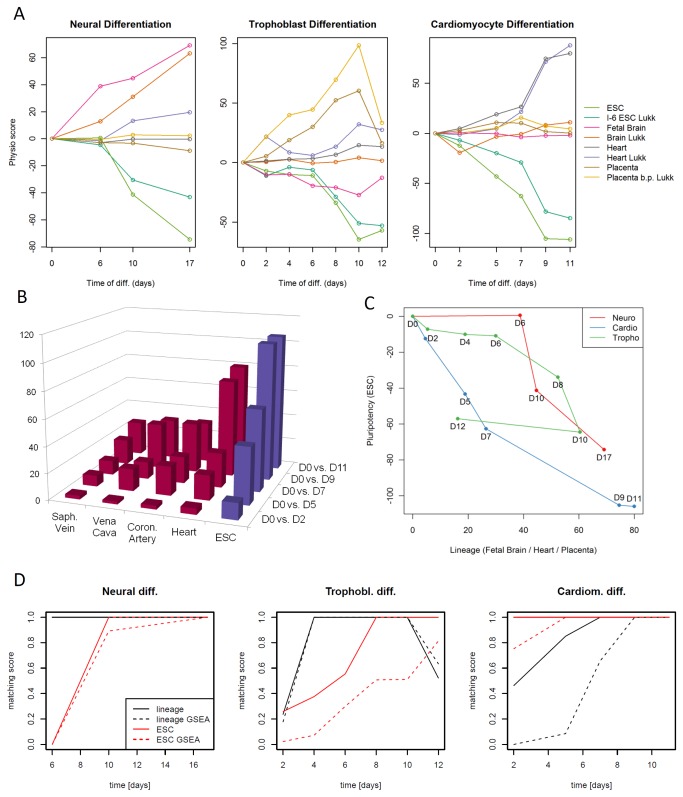
Figure 6. Detailed results of the differentiation time series analyses.
(A) Line plots of most relevant PhysioScores for the three differentiation time series comparing scores from PhysioSpaces 1 and 3. Lines with names ending with “Lukk” correspond to the third PhysioSpace (Lukk et al. 2010 [18], E-MTAB-62), other lines correspond to the first PhysioSpace (GSE7307). (B) Heart and ESC increasingly dominate leading PhysioScores in the cardiomyocyte differentiation time series. Depicted are the PhysioScores of the 5 strongest signatures from cardiomyocyte differentiation. Red (blue) colors correspond to positive (negative) PhysioScores. (C) Comparison of pluripotency (ESC) and lineage (fetal brain/placenta/heart) scores for the three differentiation time series exhibit different dynamics in PhysioSpace 1. The lineage score corresponds to the dominant lineage in each differentiation, i.e. fetal brain, placenta, and heart for the neural, trophoblast, and cardiomyocyte differentiation, respectively. (D) The matching score is used to compare the implemented PhysioSpace algorithm to a classical GSEA based algorithm, showing relatively strong differences between the two methods for the trophoblast and cardiomyocyte differentiations. The implemented PhysioSpace algorithm has generally a higher matching score.

