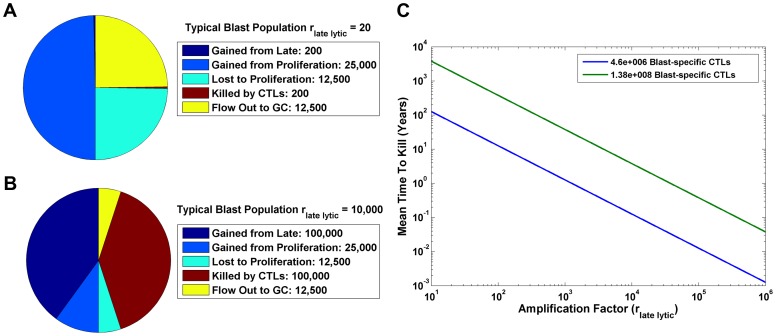
Figure 7. Analysis of the Blast compartment.
A and B) Flow rates for the Blast stage are shown using the amplification factors of 20 (A) and 10,000 (B). C) The predicted mean time between killing for CTLs specific for Blasts in Waldeyer's ring is plotted against a wide range of amplification factors. The green line represents our high estimate for this CTL population, while the blue line is the low estimate.

