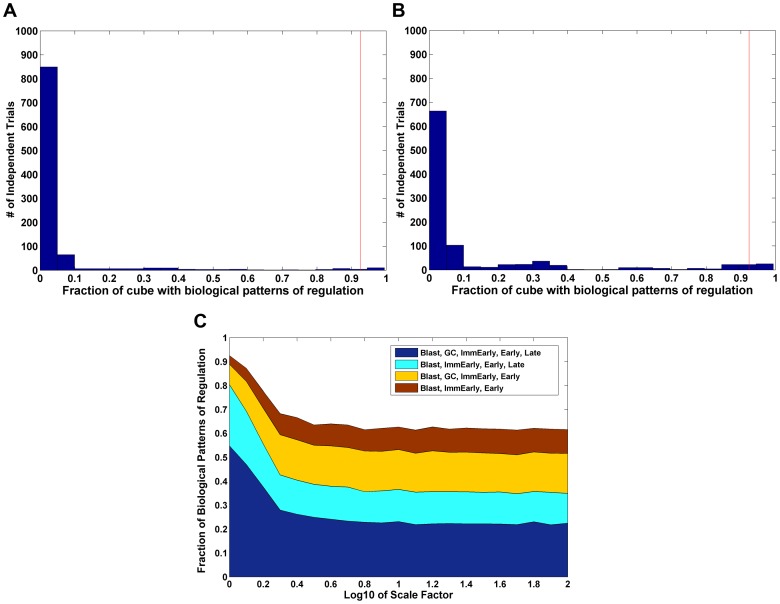
Figure 8. Validation of CPM.
A) A permutation test was performed 1000 times where the values for the parameters were randomly scrambled. For details see text. The histogram shows the number of examples where different fractions of biologically plausible patterns of regulation were seen. Note that only 13 scrambled parameter sets had an equal or higher level of biologically plausible patterns of regulation as compared to the biologically plausible parameter set (p-value of 0.013). B) A permutation test was performed 1000 times in which all parameters are permuted (as in A), with the exception of the values for ci. Note that only 33 scrambled parameter sets (holding ci constant) had an equal or higher level of biologically plausible patterns of regulation as compared to the unscrambled sets (p-value of 0.033), allowing us to reject the hypothesis that the observed patterns of regulation were determined by the values for net antigenicity. C) The range of values for each parameter was increased by up to 100-fold above what was biologically plausible and the fraction of biologically plausible patterns measured. The fraction of the parameter space which produces plausible patterns quickly falls off, demonstrating that the default set of parameters was very close to optimal.

