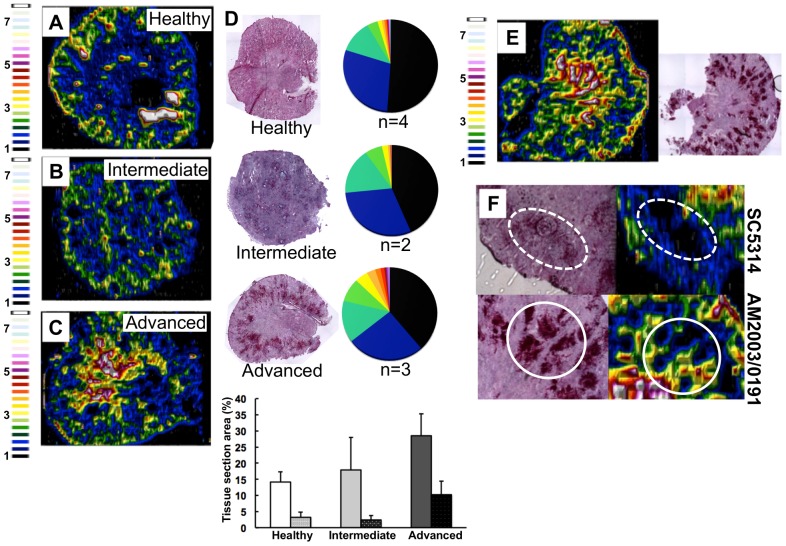
Figure 2. C. albicans infection is accompanied by dramatic changes in the renal iron landscape.
LA-ICP MS mapping of iron distribution in transverse mouse kidney sections. Normalised 56Fe/13C ratios are presented, with the colour scale indicating fold increases in signal intensities relative to background. As the infection progresses, iron loading increases and the iron becomes redistributed from the cortex of healthy kidneys (A), to the medulla in intermediate (B) and advanced infections (C). Histology insets (D) are representative of healthy, intermediate and advanced infections, and correspond to the tissues imaged in panels A–C. The pie charts in (D) present the percentage total tissue area with a given 56Fe/13C intensity and the colour scale represents increments of 0.5-fold intensity changes from background (black) to 8-fold increase (white). In the bar chart (D) bars correspond to the percentage surface area with normalized 56Fe/13C intensity ≥2-fold (left, light coloured bars) and ≥3-fold above background (right, dark coloured bars): error bars, standard deviations from the mean; n, number of biological replicates. The effects observed with the virulent C albicans isolate SC5314 (epidemiological clade 1) are replicated with a different clinical isolate AM2003/0191(clade 2) [30] (panels E and F, bottom). Infections with C. albicans SC5314 stimulate significant immune infiltrates (F, top, dotted line), while AM2003/0191 elicits minimal immune infiltrates (F, bottom, solid line).

