
Figure 3. Spatial distributions of HBA and haem mirror 56Fe distributions in healthy and infected kidneys.
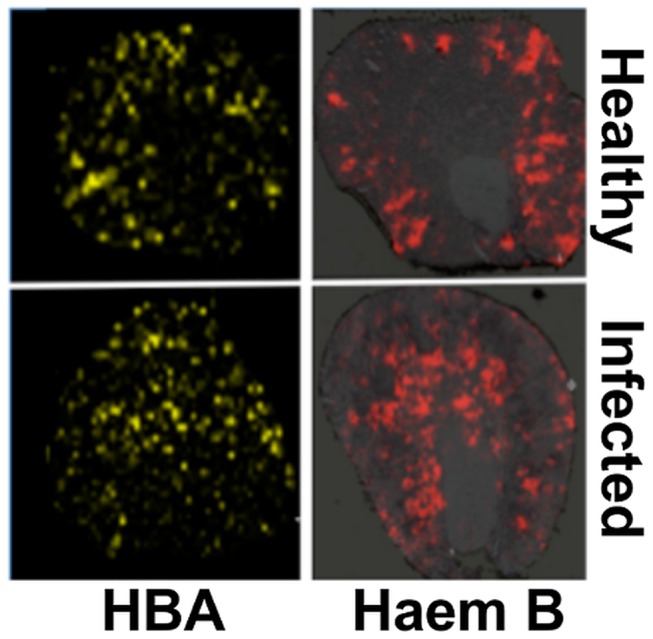
Tissue sections were analysed with MALDI IMS to map the distributions of HBA and haem B (see Materials and Methods, and Supporting Material). Similarly to iron distribution (Fig. 2), in the healthy tissue (top panels) both HBA and haem are distributed to the cortex, whereas in kidneys obtained from animals with advanced infection (bottom panels) they are medullary. Transverse kidney sections sequential to those presented in Fig. 2A (‘Healthy’) and 2C (‘Infected’), respectively, are shown. The images are representative of at least three biological replicates.