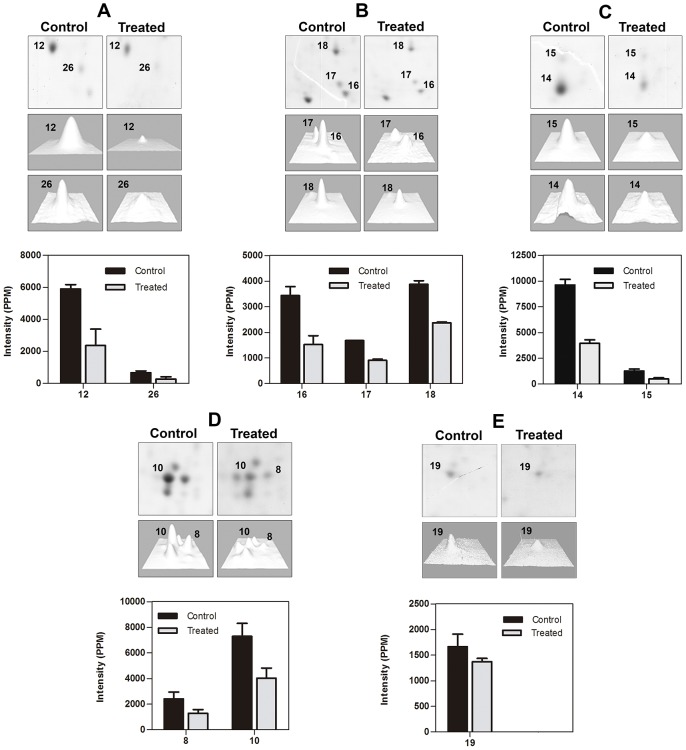
Figure 8. Close-up of the gel regions showing differentially expressed proteins in control and treated parasites.
(A–E) Close-ups of different regions of the gels showing up-regulated and down-regulated proteins. The degree of differential expression is shown in the histograms, presented as a grouped bar chart with error bars. Each bar represents the intensity means ± S.D. of gels from three independent experiments.

