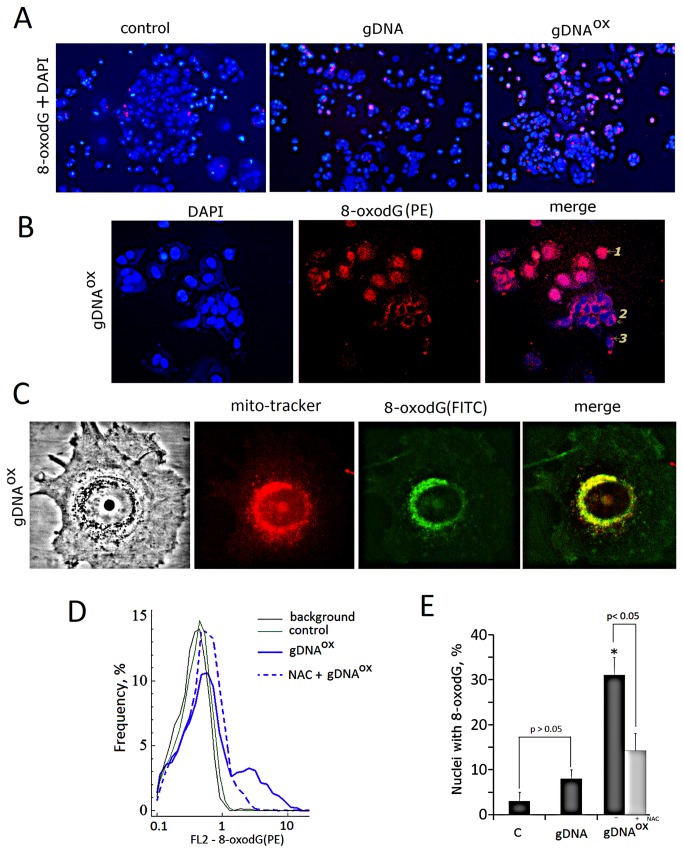
Figure 4. The analysis of 8-oxodG content in cells exposed to either gDNA or gDNAOX (50 ng/mL).
A - Cells stained with PE-labeled anti-8-oxodG antibodies and DAPI (x20). B - Three types of anti-8-oxodG stain distribution observed in cells treated with gDNAOX (x100). Cell were incubated with DNA samples for 1 hour, fixed with 3% formaldehyde, permeated with 0,1 % triton X100 and stained with anti-8-oxodG (PE-conjugated secondary antibodies). C – colocalization of 8-oxodG with mitochondria. Cells were incubated with gDNAOX for 0.5 hour, обработаны Mito-tracker (30 nM, 15 min), photographed, then fixed with 3% formaldehyde, permeated with 0,1 % triton X100, stained with anti-8-oxodG antibodies (FITC-conjugated secondary antibodies) and photographed again. D - 8-oxodG content in DNA exposed cells pre-treated with NAC (FACS analysis). Cells were incubated with NAC (0.15 mM) for 30 min, then exposed to gDNAOX for 1 hour and analyzed using anti-8-oxodG antibodies (PE-conjugated secondary antibodies). Background fluorescence was quantified using PE-conjugated secondary antibodies. E - Relative proportions of nuclei stained for 8-oxodG in non-treated control cells, cells exposed to gDNA, cells exposed to gDNAOX (grey columns). Light grey column reflects cells pre-treated with NAC and exposed to gDNAOX. *p < 0.05 against control group of cells, non-parametric U-test.

