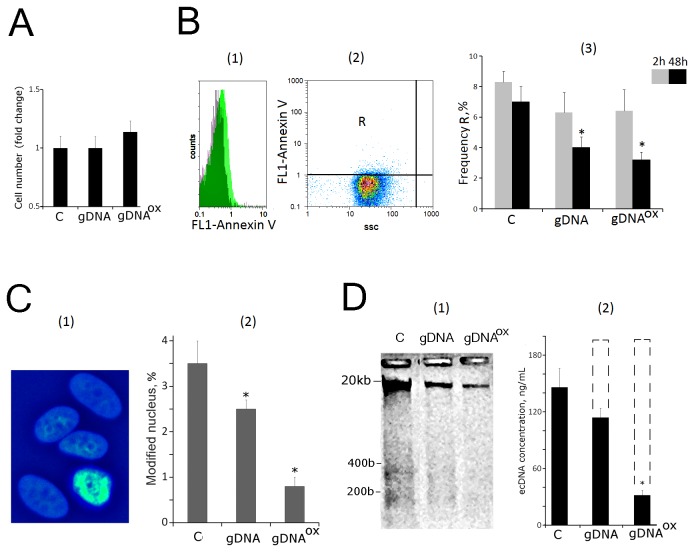
Figure 8. Cell death in MCF-7 cultures exposed to either gDNA or gDNAOX at final concentration 50 ng/mL for 48 hours.
A. Total number of cells in studied cell population.
B. (FACS) – enumeration of cells with sings of early apoptosis [1]. - the distribution of fluorescence intensities of the cells stained with Annexin V-FITC (green color) или FITC-conjugated secondary antibodies (grey color) [2]. - control cells plots: FL1 versus SSC. R: gated area [3]. - the proportion of Annexin V -positive cells in total cell population.
C. Evaluation of modified nuclei in three studies typed of MCF-7 cultures. (1) -Example of Hoechst33342 staining; (2) - Graph of the proportion of cells with modified nuclei in three studied types of MCF-7 cultures.
D. Electrophoresis [1] and evaluation of ecDNA concentrations [2] in the media of non-treated control cells and cells exposed to either gDNA or gDNAOX. Dashed line indicates amounts of ecDNA that should be present in the media when exogenous DNA is taken into account. *p < 0.05 against control group of cells, non-parametric U-test.

