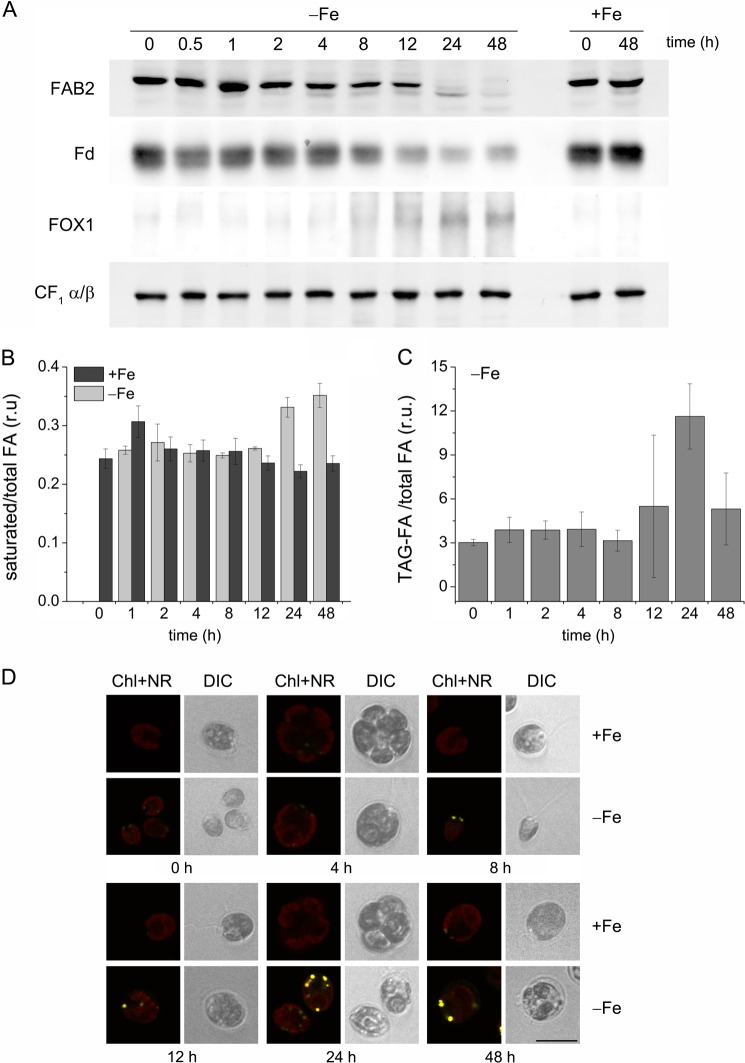
FIGURE 3.
Changes in FA saturation and TAG content occur during 12 and 24 h of iron (Fe) starvation. A, abundance of iron-containing proteins during 48 h of iron starvation. B, changes in the saturated versus unsaturated FAs distribution during the first 48 h of iron starvation. C, the fraction of total FAs in TAG during 48 h of iron starvation. D, formation of lipid droplets under iron starvation up to 48 h. See legend to Fig. 2. r.u., relative units.

