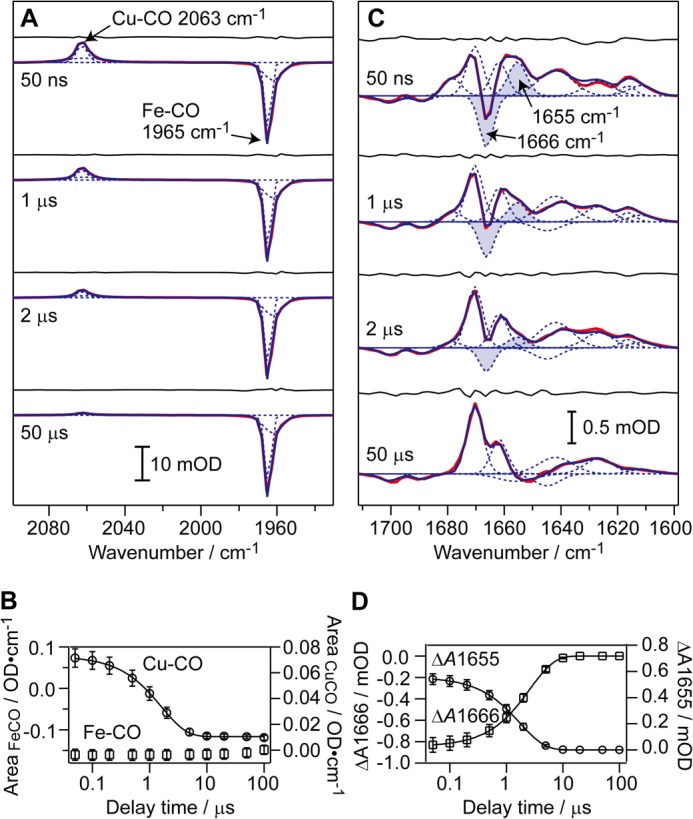
FIGURE 2.

TRIR difference spectra of CcO in H2O buffer. Red, measured spectra; blue, fitted spectra, with each Gaussian component shown by a dotted curve. The fitting residual is also shown for each spectrum. The protein concentration and optical path length were 0.72 mm and 100 μm for A and 0.68 mm and 13 μm for C. Error bars represent the standard deviation of three (B) and five (D) independent experiments performed on different days using different batches of CcO preparation.
