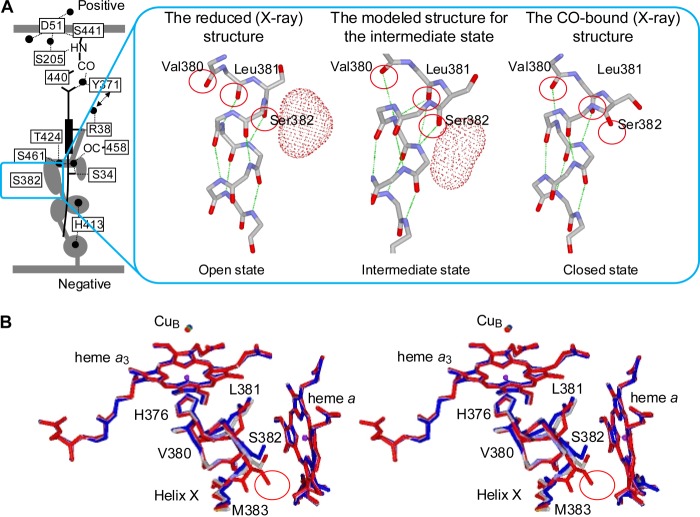
FIGURE 3.
Structural modeling of the intermediate form detected after photolysis of CO-Fea3. A, side view of the modeled structure of the intermediate form (center), compared with x-ray structures of the reduced (left) and CO-bound (right) forms. The location of the concerned helix structure in the overall proton pumping system in the reduced form is shown with a square. The red dotted surfaces (and gray portions in the left scheme) represent the water cavities identified as spaces with the radii greater than 1.2 Å. The green dotted lines indicate hydrogen bonds. The locations of water pathways are not given for simplicity. B, top stereo view of the modeled structure of the intermediate form (gray), superimposed with x-ray structures of the reduced (blue) and CO-bound (red) forms. The red circle indicates the location of the water cavity that is eliminated by Ser-382 upon CO binding.

