
FIGURE 2.
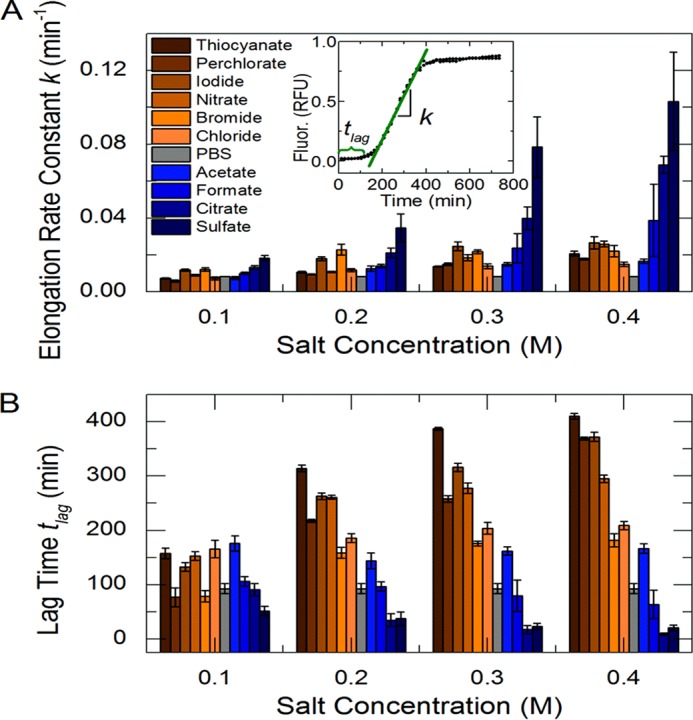
In vitro Sup35NM aggregation kinetics determined using thioflavin T fluorescence. A characteristic aggregation experiment and model parameter determination are shown in the inset to A. Chaotropes are shown in orange, and kosmotropes are shown in blue. The background buffer, PBS, without added salt is shown in gray. The elongation rate constants (A) and lag times (B) are shown over four salt concentrations. RFU, relative fluorescence units. Error bars indicate mean ± S.D.