
FIGURE 3.
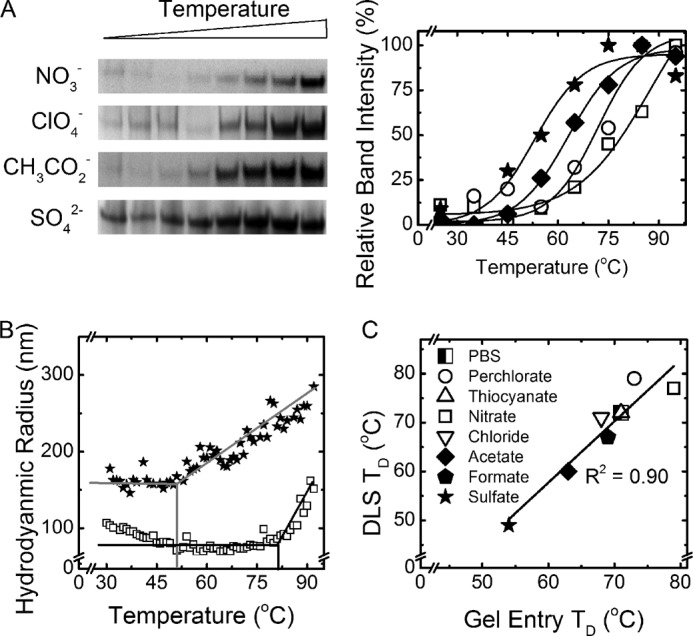
Analysis of the amyloid thermostability. A, examples of the gel entry assay are shown. B, examples of the DLS denaturation temperature ramp are shown. C, gel entry assay and DLS determined thermostability of amyloids. Chaotropes are shown with open icons, and kosmotropes are shown with closed icons.