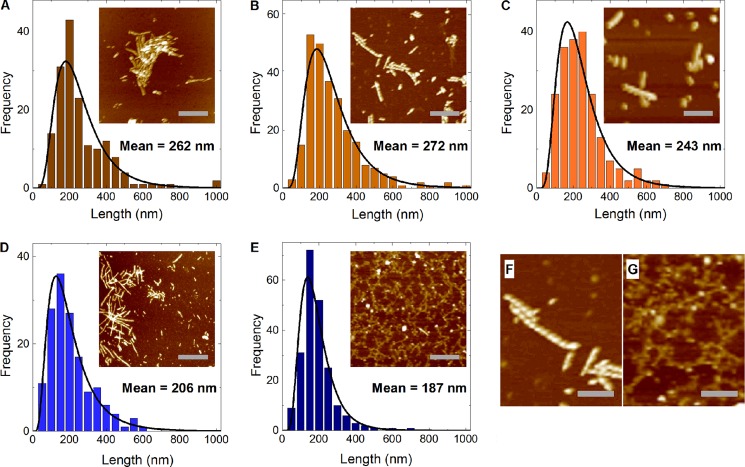
FIGURE 6.
AFM analysis of amyloid fibers. A–E, AFM analysis of the Sup35NM amyloids formed in perchlorate (A), nitrate (B), chloride (C), acetate (D), and sulfate (E). Scale bar = 500 nm. Length distributions were fit to a log-normal probability density function, shown as a black curve: f(L, μ, σ) = (1/Lσ√2π) exp(−([ln(L) − μ2])/2σ2), where L, μ, and σ are fiber length, mean, and standard deviation, respectively (44). F and G, close-up images of amyloid formed in nitrate (F), a chaotrope, and sulfate (G), a kosmotrope, are shown to contrast their structures.

