FIGURE 2.
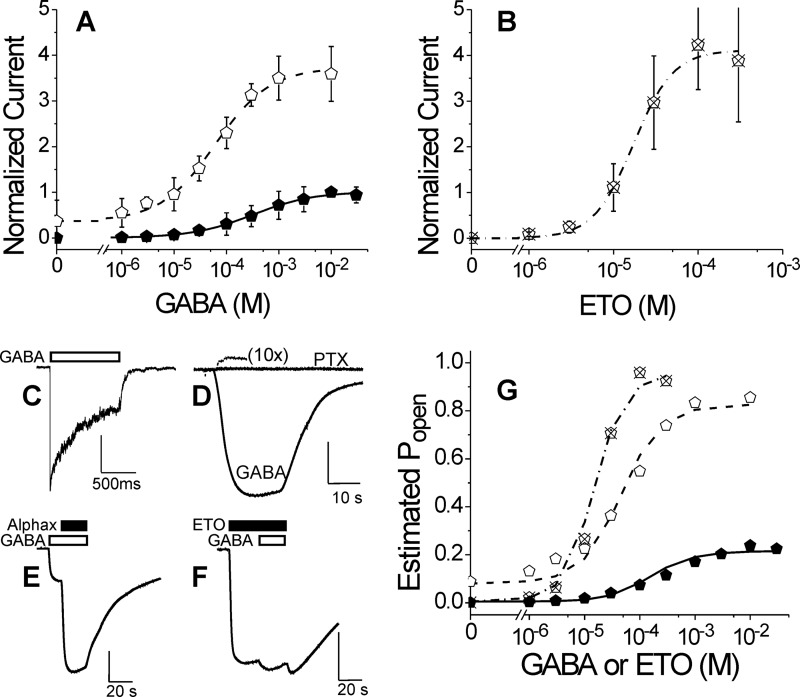
Electrophysiological characterization of α1M236Cβ2γ2L GABAA receptors. A, GABA concentration response in oocytes. Data points are mean ± S.D. (error bars) (n > 3) peak currents normalized to maximal GABA (10 mm) responses. Lines overlaying points represent nonlinear least squares fits to Hill equations (Equation 1). Solid symbols, GABA alone; EC50 = 320 μm (95% confidence interval, 290–410 μm); nH = 0.75 ± 0.075. Open symbols, GABA plus 3.2 μm etomidate; EC50 = 61 μm (95% confidence interval, 56–77 μm); nH = 0.83 ± 0.071; maximum response = 3.7 ± 0.10. B, etomidate agonism concentration response in oocytes. Data points are mean ± S.D. (n > 3) peak currents normalized to maximal GABA (10 mm) responses. The line represents a fitted Hill equation. EC50 = 18 μm (95% confidence interval, 14–29 μm); nH = 1.7 ± 0.52; maximum response = 4.2 ± 0.63. C, current sweep recorded from an HEK293 cell patch during a 1-s pulse of 10 mm GABA. The white bar indicates GABA application. Average rates of activation, desensitization, and deactivation are summarized in Table 2. D, spontaneous channel gating current in an oocyte. The small outward current during PTX application is due to inhibition of active channels. Current elicited with 10 mm GABA in the same cell is also displayed. Average spontaneous activity is 1.8 ± 0.28% of maximal GABA response. E, estimation of maximal GABA efficacy in an oocyte. GABA (10 mm; white bar) alone elicits a current that is enhanced severalfold with co-application of alphaxalone (2 μm; black bar). Average results for GABA efficacy are reported in Table 1. F, estimation of etomidate agonist efficacy in an oocyte. Etomidate (100 μm; black bar) elicits a maximal current that is only modestly enhanced with co-application of GABA (3 mm; white bar). Average results for etomidate efficacy are reported in Table 1. G, allosteric co-agonist modeling of GABA and etomidate activation. Estimated Po was calculated using Equation 2 from data in A and B (same symbols used for each data set). Equation 3 was fitted to estimated Po using nonlinear least squares with both [GABA] and [etomidate] as input variables. Lines represent the fitted model. Fitted model parameters are reported in Table 3.

