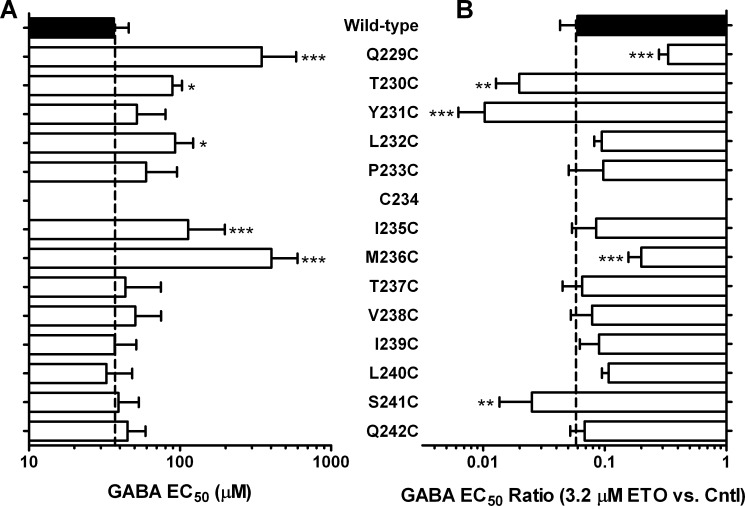
FIGURE 4.
GABA sensitivity and etomidate modulation in α1-M1 cysteine substituted GABAA receptors. A, bars represent mean ± S.D. (error bars) GABA EC50 plotted on a log scale, averaged from multiple individual measurements in separate oocytes (n ≥ 4). B, bars represent mean ± S.D. GABA EC50 shift ratio in the presence versus absence of 3.2 μm etomidate, averaged from multiple individual measurements in separate oocytes (n ≥ 4) and plotted on a log scale. Large leftward shifts (low shift ratio) indicate high etomidate sensitivity. Mutant results were compared with wild type by ANOVA with Dunnett's post hoc test. *, p < 0.05; **, p < 0.01; ***, p < 0.001.

