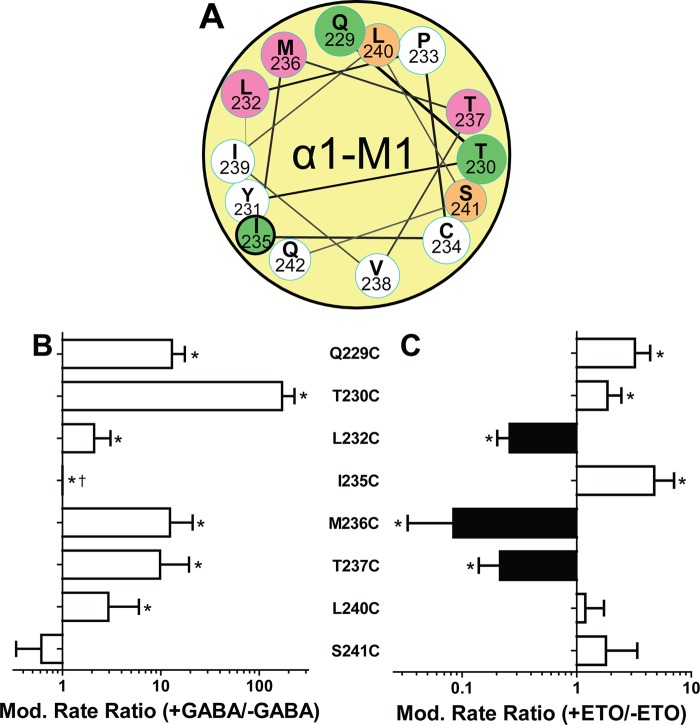
FIGURE 5.
Effects of GABA and etomidate on modification rates of pCMBS-accessible α1-M1 cysteine substituted GABAA receptors. A, a helical wheel projection of α1-M1 similar to that in Fig. 1B shows pCMBS-modified residues as colored circles; green, modification enhanced by etomidate; magenta, modification reduced by etomidate. The heavy outline around Ile-235 indicates modification only in the presence of GABA. B, bars represent log ratios (mean ± S.D. (error bars)) of pCMBS modification rates measured in the presence of maximally activating GABA (>10 × EC50) to the rate without GABA (n ≥ 3 for each condition). *, rates in the presence versus absence of GABA differ significantly with p < 0.05. †, a ratio for I235C could not be calculated because no modification was evident without GABA. C, bars represent log ratios (mean ± S.D.) of pCMBS modification rates measured in the presence of maximally activating GABA plus etomidate (30–100 μm) to rates in the presence of GABA alone (n ≥ 3 for each condition). Black bars, reduced rates; white bars, increased rates. *, rates in the presence versus absence of etomidate differ significantly with p < 0.05.

