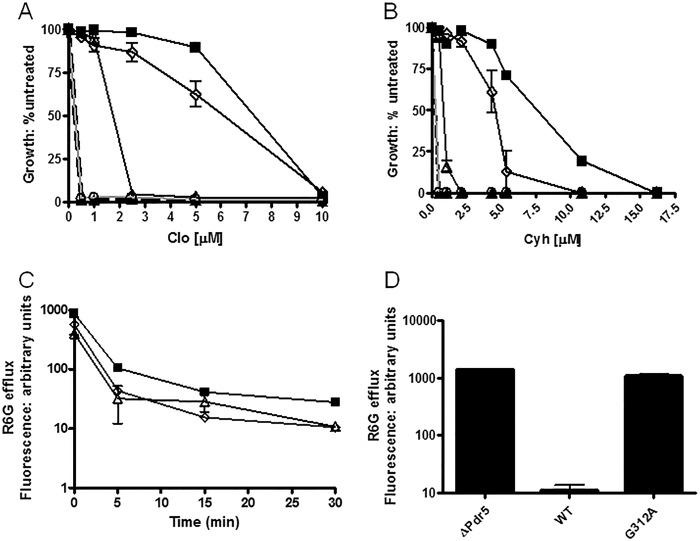
FIGURE 3.
Quantitative analysis of drug resistance and R6G transport indicates that deviant site mutants retain significant efflux capability. We evaluated drug resistance in liquid (YPD) culture as previously described (14). We seeded 2 ml of YPD broth with 0.5 × 10⁵ cells and incubated them for 48 h at 30 °C in the presence of the drug prior to determining the cell concentration at A600. A and B, plots for clo (A) and cyh (B). We performed the plots and statistical analyses with GraphPad Prism software. The data points are the averages of at least three independent experiments. In A and B, ■, WT; ▴, Δpdr5; ▵, E1013A; ♢, C199A; ○, G312A C, R6G efflux was measured in C199A (♢) and E1013A (▵), along with a positive control (WT, ■) for 0, 5, 15, and 30 min after loading cells with 10 μm R6G for 90 min without glucose, as described under “Experimental Procedures.” We used the median of the retained fluorescence from each sample as the values in the plots, which are the averages of two independent experiments. In each sample, 10,000 cells were counted. D, comparison of WT, Δpdr5, and the G312A mutant after 30 min of efflux of R6G in 0.05 m Hepes, 1 mm glucose buffer.

