
FIGURE 7.
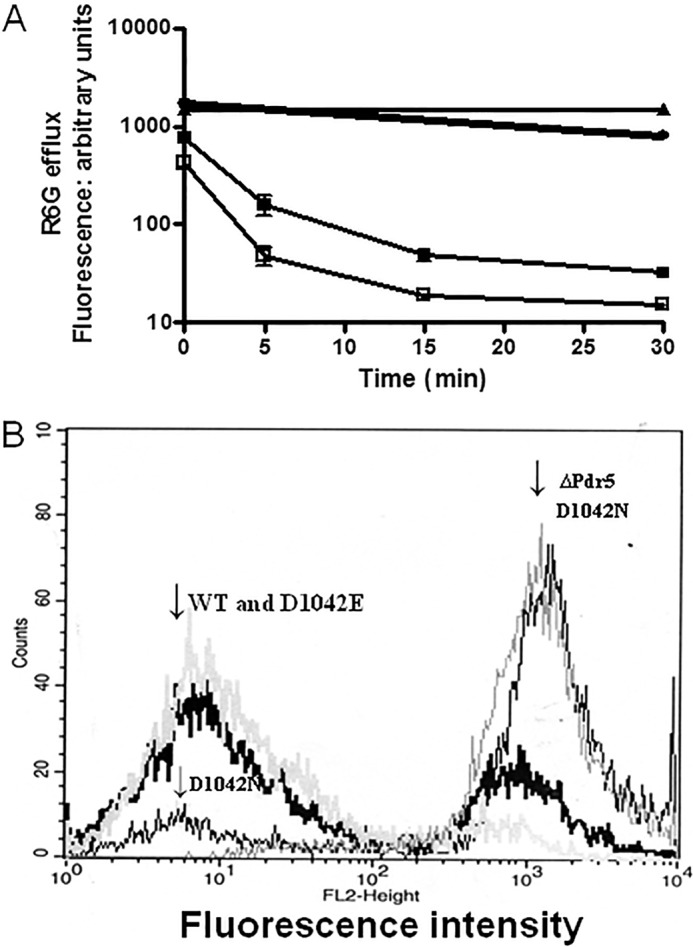
Analysis of R6G transport in whole cells demonstrates that the D1042N mutant is severely impaired. A, R6G efflux in whole cells was performed as described in the legend to Fig. 3 and under “Experimental Procedures.” ■, WT; ▴, ΔPdr5; ●, D1042N; □, D1042E. In these experiments, n = 2. B, histogram plots for cells showing the retained fluorescence after 30 min in 0.05 m Hepes, 1 mm glucose buffer. The positions of the major peaks for WT, ΔPdr5, D1042E, and D1042N are indicated.