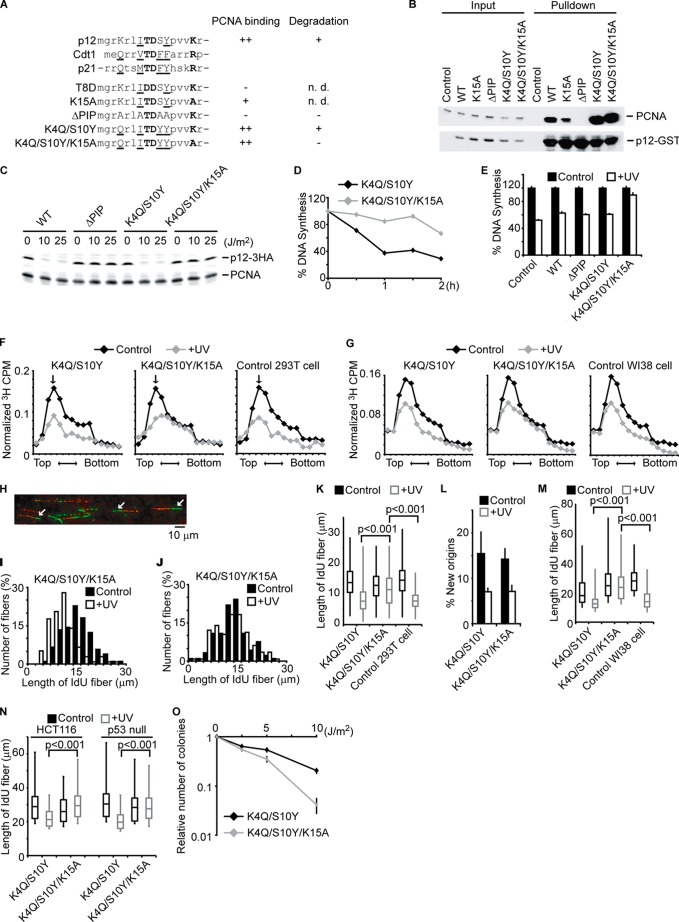
FIGURE 2.
The degradation of p12 inhibits fork progression during S-phase and is required for cell survival after DNA damage. A, alignment of PIP degrons in p12, Cdt1, and p21. Underlined residues constitute a canonical PIP box. Bold letters are highly conserved residues that predict PIP degrons, promoting ubiquitination by CRL4Cdt2. A summary of the PCNA binding and post-UV degradation of the mutants is shown. B, 293T cells were transfected with the plasmids coding GST-tagged p12 (WT or mutant), lysed, and pulled down by glutathione beads. The cell lysates (Input) and eluates (Pulldown) were analyzed by immunoblotting with anti-PCNA and anti-GST antibody. n.d., not determined. C, 293T cells stably expressing HA-tagged p12 (WT or mutant) were irradiated with UV at the indicated doses. One hour later, cells were lysed and analyzed by immunoblotting with anti-HA or anti-PCNA antibody. D, 293T cells expressing p12K4Q/S10Y or p12K4Q/S10Y/K15A were irradiated with UV (15 J/m2). 15 min before harvesting at the indicated times, cells were labeled with [3H]thymidine, and incorporated radioactivity was measured. E, 293T cells expressing the indicated p12 mutant were irradiated with UV (15 J/m2) and harvested 1 h after irradiation. 15 min before harvesting, cells were labeled with [3H]thymidine, and incorporated radioactivity was measured. Error bars indicate mean ± S.D. of three experiments. F, similar experiments were performed as in C. The size distribution of nascent DNAs was determined by alkaline-sucrose gradient. The arrow indicates a peak of λ DNA (48 Kb). G, similar experiments were performed as in F by using WI38 cells. H, a representative image of DNA fiber assay is shown. The arrows indicate ongoing forks where a green IdU track extends a red CldU track. I–K, 293T cells expressing mutant p12 were incubated with CldU for 20 min. After irradiation of UV (15 J/m2), cells were immediately incubated with IdU for 30 min. DNA was spread on a glass slide and detected by immunofluorescence. More than 100 fibers of ongoing replication fork progression (green IdU tracks that extend red CldU tracks) were measured. Histograms of green track lengths are shown in I and J. K, 293T cells without (Control) or with stable expression of p12 mutants were subjected to similar experiments as I and J. Distributions of green track lengths are shown as box plot. The p values were calculated using the Mann-Whitney U test. L, new origin firing rates were measured by counting green-only tracks divided by the total of red+green or red-only tracks. The bars and lines represent the mean ± S.E. of three independent experiments. M and N, WI38 cells, HCT116, and HCT116p53−/− cells were tested as in K. Distributions of green track lengths are shown as box plot. The p values were calculated using the Mann-Whitney U test. O, 293T cells expressing mutant p12 were irradiated with the indicated dose of UV. The number of colonies was counted 10 days after irradiation. The number of colonies relative to nonirradiated cells is shown. Error bars indicate mean ± S.D. of three experiments.

