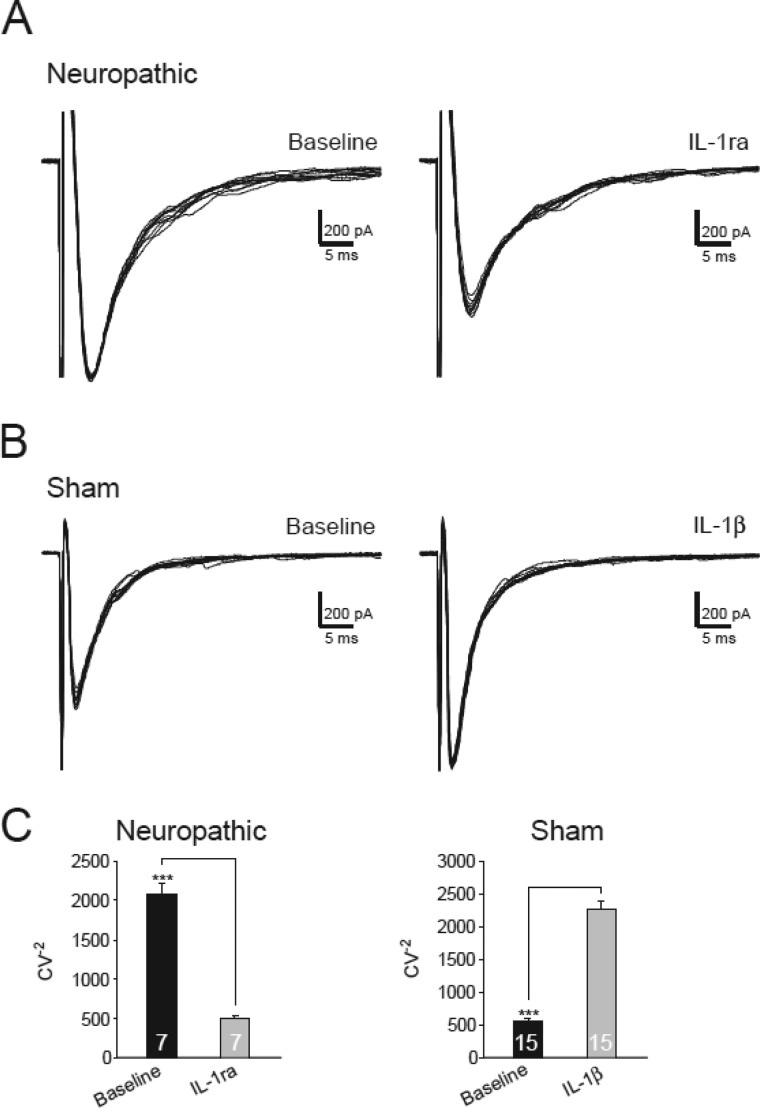
FIGURE 5.
Activation of IL-1β receptors increases the inverse squared coefficient of variation. A, samples of variability of 10 evoked EPSCs collected from a neuron from neuropathic rats before and after bath perfusion of IL-1ra (100 ng/ml). B, samples of variability of 10 evoked EPSCs collected from a neuron from sham-operated rats before and after bath perfusion of IL-1β (10 ng/ml). C, bar graphs show the mean (+ S.E.) CV−2 before (base line) and after perfusion of each tested agent. The number of neurons included in each group for the analysis is shown in each bar. ***, p < 0.001.

