
FIGURE 7.
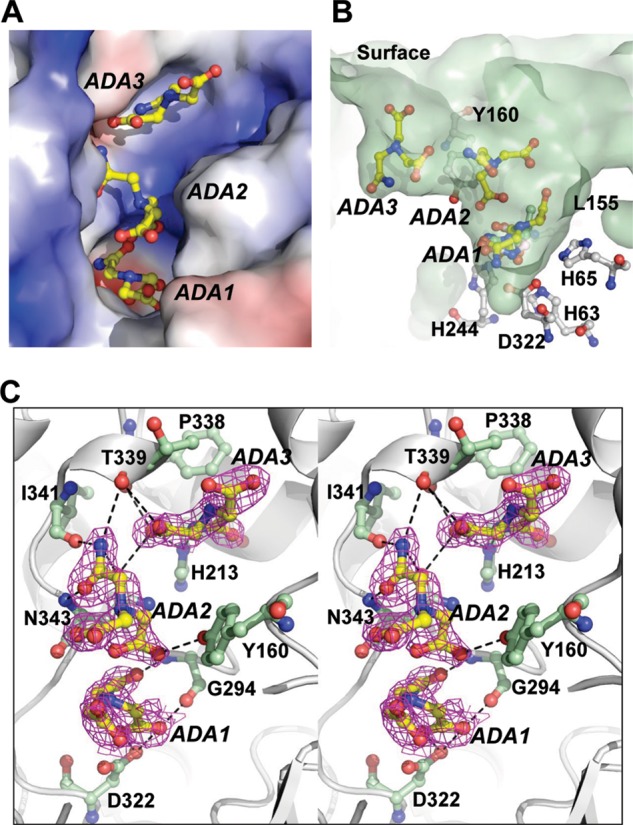
The ADAs in complex with apo-TnDhp. A, there are three ADAs (yellow), labeled ADA1, ADA2, and ADA3, bound in the tunnel of the active site. The electrostatic potential surface shows the charge distribution within the tunnel (blue, positive; red, negative). B, the surface shows the side view of the tunnel (light green). Three ADAs are lined up from the active site to the surface. The ADA1 is in the same location as the substrates in the active site. ADA3 is the closest to the surface. Tyr160 is located between ADA2 and ADA3. C, stereoview of the residues (light green) interacting with the ADAs (yellow). The electron density (2Fo − Fc map 1.0 σ) is shown in magenta.