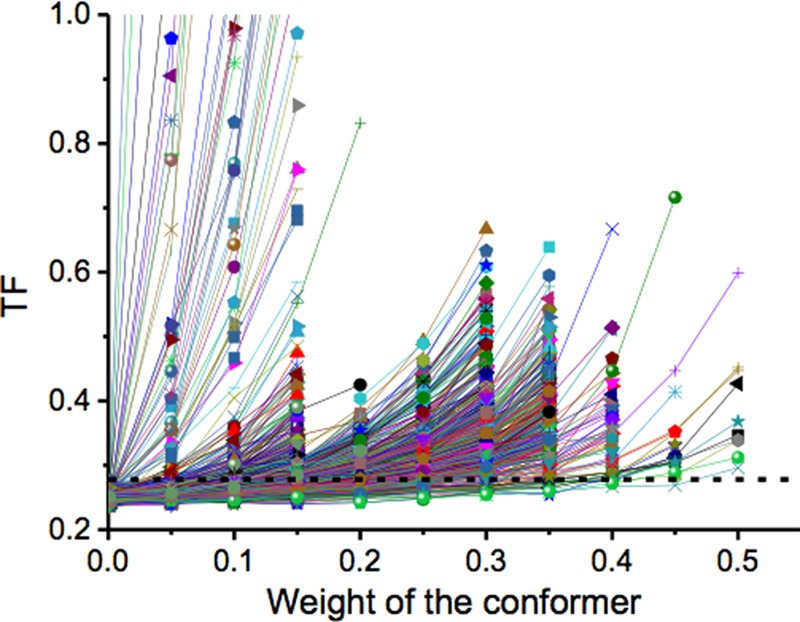
FIGURE 3.

Progression of the TFs as a function of the weight given to the selected structure within the minimized ensemble of 50 structures. The dashed line represents the threshold at which the MO value was assigned when intercepted by the TF. The TF for the 1,000 calculated structures is represented.
