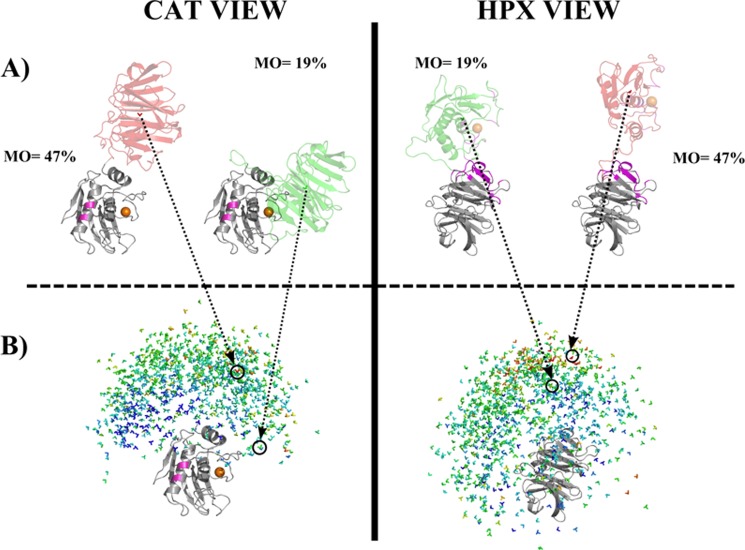
FIGURE 4.
Visualization of the results of MO calculations for 1,000 randomly selected MMP-1 conformations. The conformations are displayed superimposed on the CAT domain (left) and on the HPX domain (right). The catalytic metal was represented as an orange sphere. Within the CAT domain (left), the residues in pink are those mutated to Cys to incorporate (Ln)CLaNP-5. In the HPX domain (right) the residues that were experimentally found to interact with a triple-helical peptide (9) are shown in magenta. B, simplified representation of 1000 conformations selected randomly with the allowed conformational space. Each conformation was represented, for graphical simplicity, as a color-coded 3-axes system, positioned in the center of mass of the HPX (left column) or CAT (right column) domain. Colors from blue (<5%) to red (47%) represent the MO values of the various structures. A, the structure with the highest MO (47%) and the x-ray crystallographic structure 2CLT are colored according to their MO values. In the center of mass, the 3-axes system associated with the structure is shown. Both the perspective of the CAT (left) and HPX domains (right) are represented.

