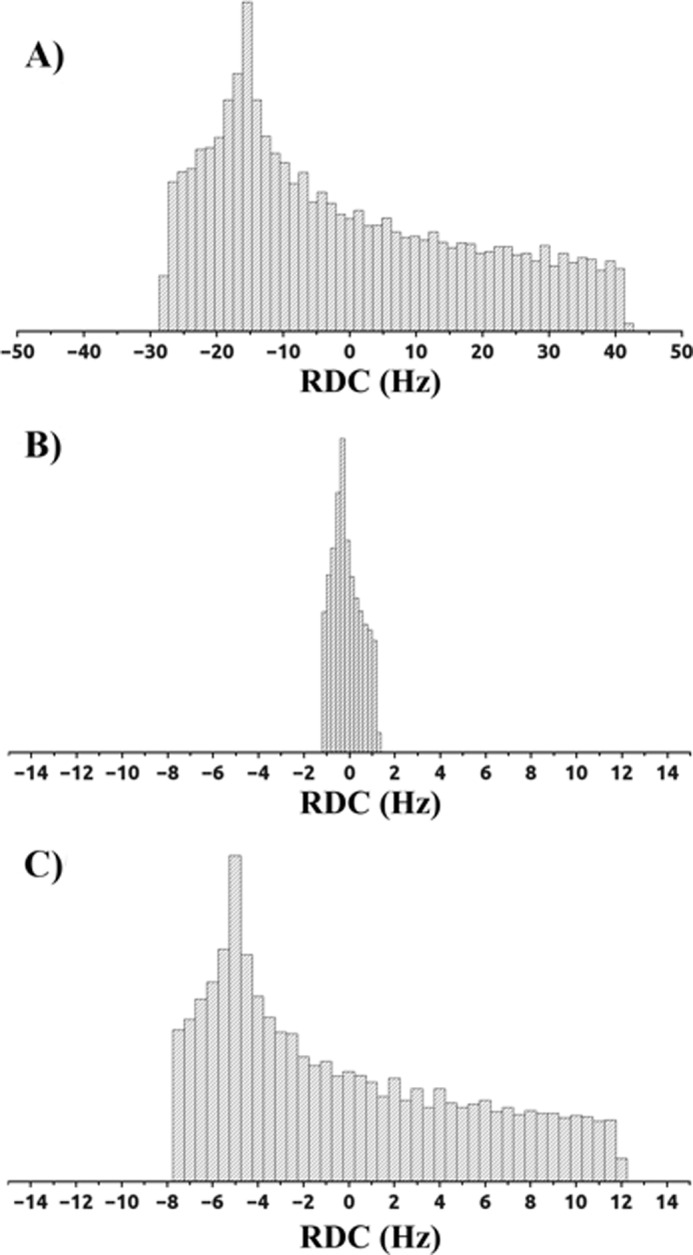
FIGURE 6.

Distribution of the RDC values (Hz) of the (Tm3+)CLaNP-5 MMP-1 HPX domain based on the magnetic susceptibility tensors obtained from (A) experimental PCS of the CAT domain, (B) average RDC of the HPX domain obtained from sterically allowed uniformly sampled conformations, and (C) experimental RDC of the HPX domain.
