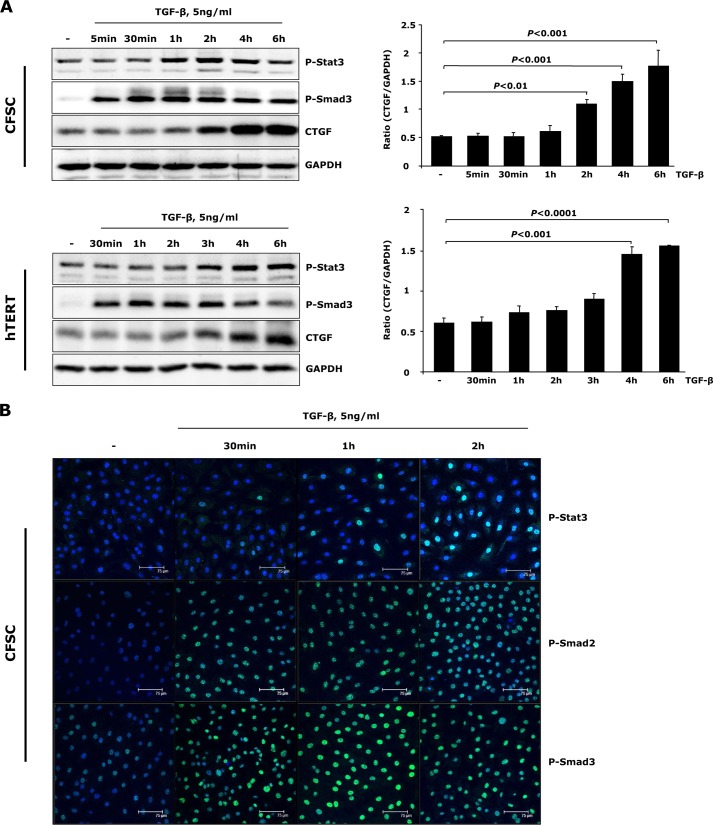
FIGURE 2.
TGF-β induces Stat3 activation and CTGF expression in activated HSCs. A, CFSC-2G (CFSC) cells and hTERT HSCs were treated with 5 ng/ml TGF-β1 for the indicated time periods. Western blot analysis unraveled tyrosine Stat3 phosphorylation prior to significant CTGF expression upon TGF-β challenge. CTGF and GAPDH were quantified by densitometric analysis and expressed as a ratio of CTGF to GAPDH. Data are means ± S.E. p < 0.01, p < 0.001, and p < 0.0001 indicate the statistical significance. B, CFSC-2G cells were stimulated with TGF-β1 for 0.5–2 h. Time-dependent p-Stat3 and p-Smad2/3 nuclear translocation was shown with immunofluorescence.

