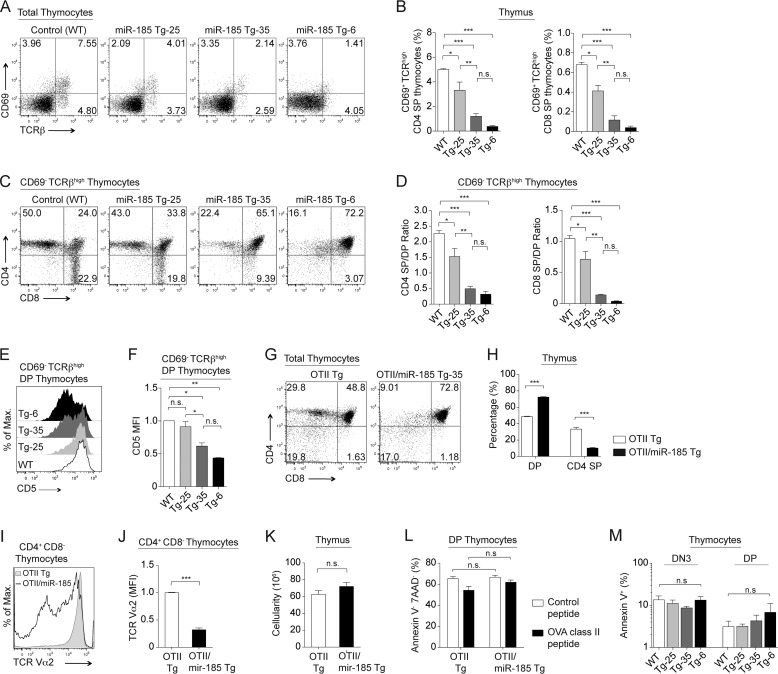
FIGURE 3.
Increasing levels of miR-185 attenuate T cell development at TCR-positive selection checkpoint. A, flow cytometric analysis of CD69 and TCRβ expression on total thymocytes from the control and miR-185 Tg mice. B, percentages of CD69+TCRβhigh CD4 SP and CD69+TCRβhigh CD8 SP thymocytes are shown. C, plots represent CD4 by CD8 profiles of CD69−TCRβhigh thymocytes. D, cellularity ratios of the CD69−TCRβhigh CD4 SP (left) and the CD69−TCRβhigh CD8 SP (right) to the CD69−TCRβhigh DP thymocytes were established for the results shown in C. E, histogram shows CD5 expression on CD69−TCRβhigh DP thymocytes. F, relative mean fluorescence intensity (MFI) levels of CD5 in CD69−TCRβhigh DP thymocytes. A–F, each bar is the mean ± S.E. of three independent experiments (n.s. = nonsignificant, *, p < 0.05, **, p < 0.01, ***, p < 0.001; one-way ANOVA followed by Tukey's post hoc test). G, flow cytometric analysis of CD4 and CD8 expression on total thymocytes from OTII Tg and OTII/miR-185 Tg-35 mice. H, average percentages of DP and CD4 SP thymocytes are shown. I, surface expression of TCR Vα2 gated on CD4+CD8− thymocytes from OTII Tg (dark gray) and OTII/miR-185 Tg-35 mice (black line). J, relative mean fluorescence intensity (MFI) levels of TCR Vα2 on CD4+CD8− thymocytes. K, total thymus cellularity of OTII Tg and OTII/miR-185 Tg mice was represented. G–K, data are of at least six mice per group. Bar graphs represent the mean ± S.E. values (*, p < 0.05, **, p < 0.01, ***, p < 0.001; two-tailed unpaired Student's t test). L, live (annexin V− 7-aminoactinomycin D− (7AAD−)) percentages of DP thymocytes upon in vitro treatment of OTII Tg and OTII/miR-185 Tg thymocytes with SIINFEKL peptide as a negative control and OVA class II peptide. Each bar is the mean ± S.E. of three mice per group (n.s. = nonsignificant, *, p < 0.05, **, p < 0.01, ***, p < 0.001; two-way ANOVA followed by Bonferroni's post hoc test). M, graph shows the mean ± S.E. percentages of annexin V+ DN3 and DP thymocytes from control (white), Tg-25 (light gray), Tg-35 (dark gray), and Tg-6 (black) mice (n = 3 mice per group) (n.s. = nonsignificant, *, p < 0.05, **, p < 0.01, ***, p < 0.001; one-way ANOVA followed by Tukey's post hoc test).

