FIGURE 4.
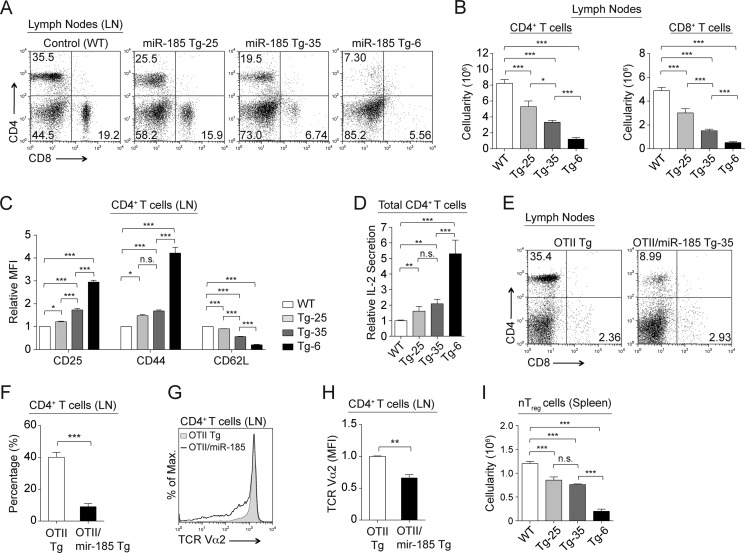
Elevated levels of miR-185 cause a peripheral T cell lymphopenia. A, flow cytometric analysis of CD4+ and CD8+ T cells in the lymph nodes from normal and miR-185 Tg mice. B, bar graphs show absolute numbers of CD4+ and CD8+ T cells in the lymph nodes in the control and miR-185 Tg mice. Data are of the mean ± S.E. from WT (n = 40), Tg-25 (n = 16), Tg-35 (n = 46), and Tg-6 (n = 59) mice (*, p < 0.05, **, p < 0.01, ***, p < 0.001; one-way ANOVA followed by Tukey's post hoc test). C, relative mean fluorescence intensity (MFI) levels ± S.E. of CD25, CD44, and CD62L markers on CD4+ T cells in the lymph nodes of WT (white), Tg-25 (light gray), Tg-35 (dark gray), and Tg-6 (black) mice using at least five mice per group (n.s. = nonsignificant, *, p < 0.05, **, p < 0.01, ***, p < 0.001; one-way ANOVA followed by Tukey's post hoc test). D, graph represents relative IL-2 secretion from anti-CD3ϵ/CD28 stimulated total CD4+ T cells in miR-185 Tg lines and the control (WT), set to 1. Each bar is the mean ± S.E. of at least five independent experiments (n.s. = nonsignificant, *, p < 0.05, **, p < 0.01, ***, p < 0.001; Two-tailed unpaired Student's t test). E, lymphocytes from the lymph nodes of OTII Tg and OTII/miR-185 Tg mice were stained for CD4 and CD8 and analyzed by FACS. F, average percentages of CD4+CD8− T cells in the lymph nodes. G, surface expression of TCR Vα2 gated on CD4+CD8− T cells from the lymph nodes of OTII Tg (dark gray) and OTII/miR-185 Tg mice (black line). H, relative mean fluorescence intensity (MFI) levels of TCR Vα2 on CD4+CD8− lymphocytes. E–H, data are of at least six mice per group. Bar graphs represent the mean ± S.E. values (*, p < 0.05, **, p < 0.01, ***, p < 0.001; two-tailed unpaired Student's t test). I, graph shows absolute numbers of natural regulatory T (nTreg) cells in the spleen of the control and miR-185 Tg mice. Data are of the mean ± S.E. from at least three mice per group (n.s. = nonsignificant, *, p < 0.05, **, p < 0.01, ***, p < 0.001; one-way ANOVA followed by Tukey's post hoc test).

