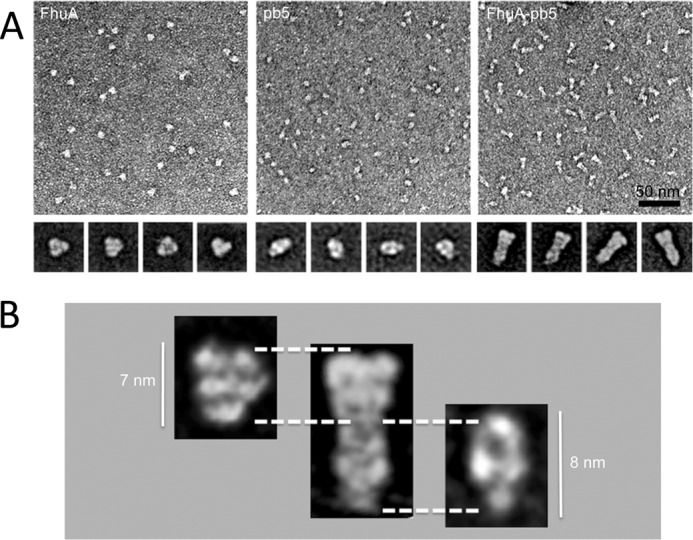
FIGURE 5.

Negative stain electron microscopy. A, negative stain electron microscopy of purified FhuA (left), pb5 (middle), and FhuA-pb5 complex (right). The insets are their corresponding averages of the major classes. Scale bar, 50 nm; inset base line, 20 nm. B, FhuA and pb5 proteins are identified on the FhuA-pb5 complex.
