Fig. 8.
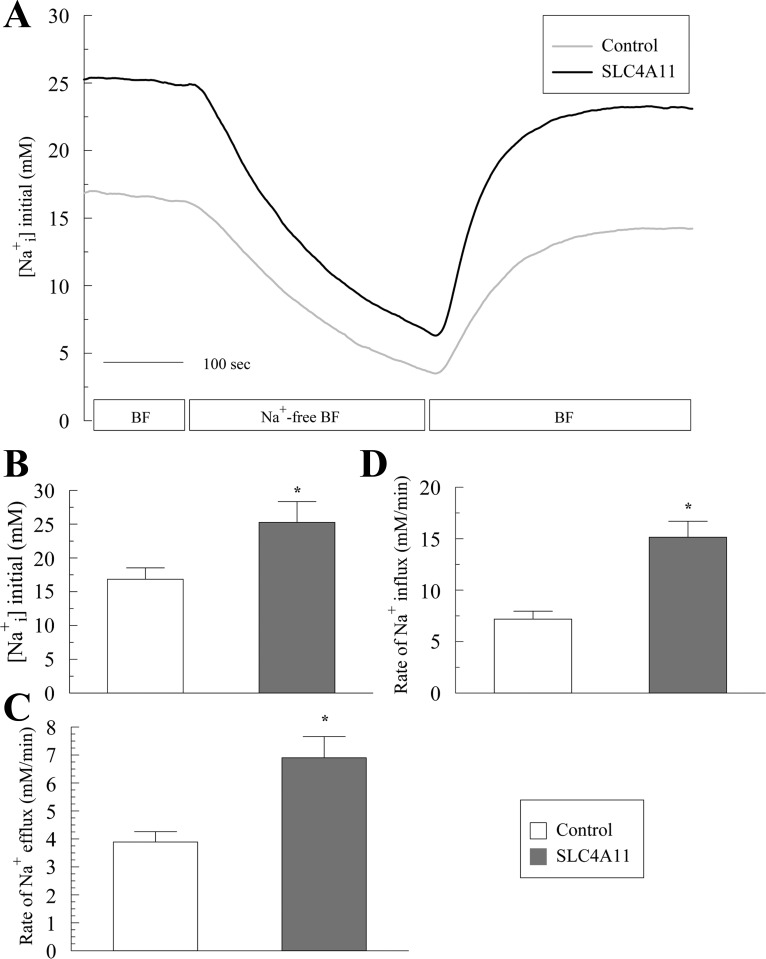
Sodium fluxes following a 5-min sodium free pulse in BF in SLC4A11-transfected and control HEK293. A: [Na+]i in response to Na+ removal and add back in BF. Traces represent the average of 8 experiments. B: resting [Na+]i in bicarbonate-free Ringer. C: Na+ efflux rates. D: Na+ influx rates. *P < 0.05.

