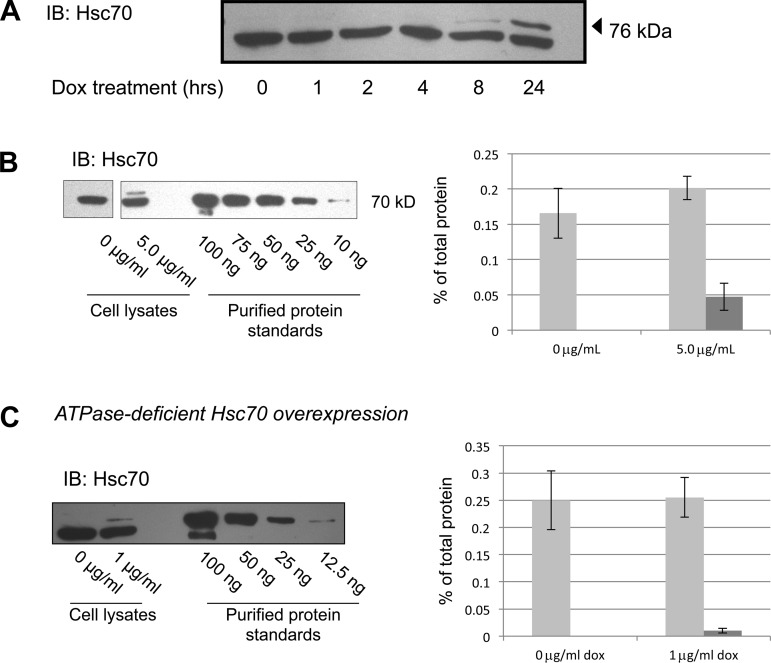
Fig. 2.
Increased expression of Hsc70 in MDCK cell lysates. A: MDCK cells were treated with 5 μg/ml Dox for 0–24 h, and Hsc70 was detected in cell lysates by immunoblot (IB). Lower and upper bands represent endogenous Hsc70 protein and Myc/His-tagged construct of Hsc70 protein, respectively. B and C: immunoblot determination of Hsc70 and ATPase-deficient Hsc70 expression after 24 h of incubation with the indicated concentration of Dox. This immunoreactivity was compared with that of purified Hsc70 protein to quantify Hsc70 expression. The 0 μg/ml and 5 μg/ml and protein standard lanes in B are from noncontiguous portions of the same immunoblot. Densitometric analysis of 4 independent experiments quantifying endogenous (light bars) and overexpressed (dark bars) chaperone are shown. Error bars, SE.

