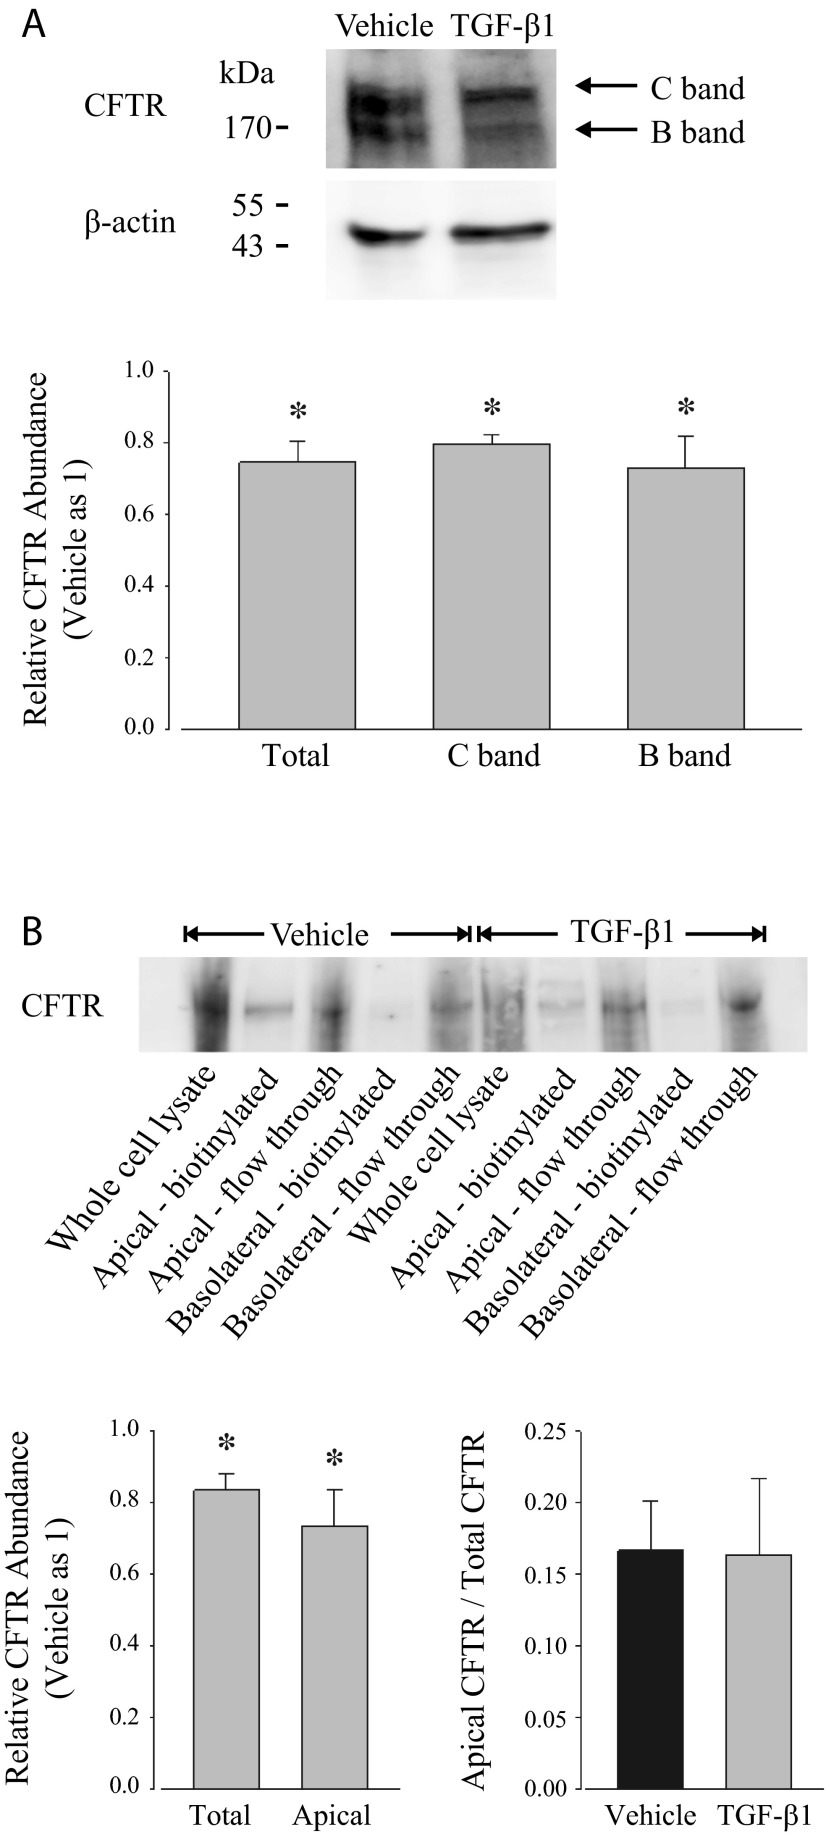
Fig. 6.
TGF-β1 reduces CFTR abundance in cell lysates and in the apical cell surface. A: CFTR expression was assessed in whole cell lysates from PVD9902 monolayers exposed to vehicle or TGF-β1 (5 ng/ml, 24 h) by Western blots. Densitometric analysis was conducted to quantify signal intensity that could be attributed to total CFTR (C band and B band), fully glycosylated CFTR (C band), and core-glycosylated CFTR (B band). Data are expressed as relative abundance in CFTR normalized to β-actin with respect to vehicle. Data are summarized from 4 independent experiments. B: apical cell surface CFTR expression was determined by biotinylation and Western blots from PVD9902 monolayers exposed to vehicle or TGF-β1 (5 ng/ml, 24 h). Densitometric analysis was conducted to determine protein abundance of total CFTR and apical cell surface CFTR. Summarized relative CFTR abundance is from 6 independent experiments. *P < 0.05, significant reductions compared with vehicle.

