Fig. 7.

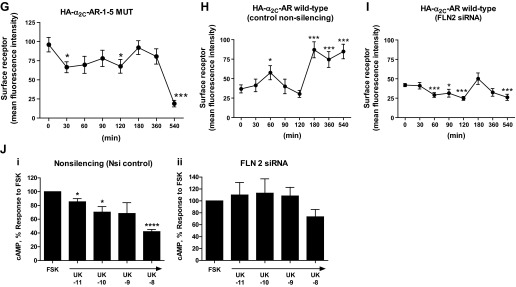
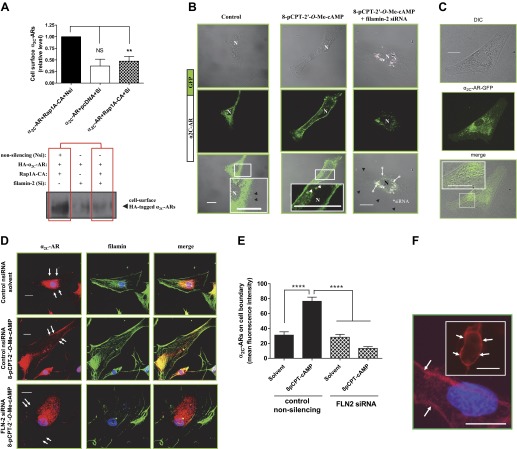
(Continued Caption)—Filamin-2 and α2C-AR translocation. A: quantitation of surface α2C-ARs. Live labeling, immunoprecipitation, and Western blot analysis to assess cell surface α2C-ARs after filamin-2 knockdown in transiently transfected HEK293 cells. Cells were co-transfected with small interfering (si)RNAs (nonsilencing or filamin-2 silencing), backbone plasmid DNA (pcDNA), plasmid DNA expressing amino-terminal HA-tagged α2C-AR and the constitutively activated form of Rap1A (Rap1A-CA). The outcome on cell surface α2C-ARs in the presence of control siRNA or in the presence of filamin-2 targeting siRNAs is highlighted by boxed regions in red. Nsi, nonsilencing siRNA; Si, silencing siRNA; Rap1A-CA, constitutively activated Rap1A. Data were normalized to the total α2C-ARs expression (not shown). **P < 0.01; NS, not significant. B: live-cell imaging of GFP-α2C-ARs in human microVSM: α2C-AR-GFP were found in intracellular vesicular structures that were delivered to the plasma membrane in response to Epac-Rap1 activation by 8-pCPT-2′-O-Me-cAMP (100 μM, 9–10 h). Note perinuclear α2C-AR-GFP localization in control (solvent-treated microVSM), and cell-surface α2C-AR-GFP localization in cells treated with 8-pCPT-2′-O-Me-cAMP. Live cell imaging of α2C-AR-GFP in microVSM in the presence of silencing siRNA to filamin-2 (includes 3′-Alexa Fluor-647 labeled siRNA; *arrows point to fluorescent siRNA; pink). Note perinuclear location of siRNA and absence of cell-surface receptors. Control, quiescent microVSM, or 8-pCPT-2′-O-Me-cAMP treated. Arrowheads (white) point to vesicles, and (black) point to cell boundary, visualized by transmission light microscopy. N, nucleus. Scale bars = 20 μm. C: differential interference contrast-fluorescence imaging of human microVSM transfected with α2C-AR-GFP. Tagged receptors can be seen in intracellular vesicular compartments. Scale bar = 20 μm. D: knockdown of filamin-2 (FLN-2) disrupts colocalization with α2C-ARs and reduces cell boundary α2C-ARs compared with control nonsilencing siRNA (nsiRNA). Arrows indicate cell boundary. Human microVSM (with nsiRNA or FLN-2 siRNA) were treated with H2O for 9 h (solvent-control) or with 8-pCPT-2′-O-Me-cAMP (100 μM, 9 h), and cells were fixed and stained for endogenous α2C-ARs (Alexa Fluor-568, red), filamin (Alexa Fluor-488, green), and nuclei (Hoechst, blue). Scale bars = 20 μm. E: quantitation of mean fluorescence intensity of cell boundary α2C-ARs, assessed at 4 different regions of the cell boundary per cell. Data from 12–13 cells per condition are shown, ****P < 0.0001. F: immunofluorescence assessment of surface receptors using amino-terminal HA-tagged α2C-ARs. In human microVSM nucleofected with HA-α2C-AR-1–5 MUT and pmaxGFP (quiescent, untreated cells), or HEK293 cells cotransfected with HA-α2C-AR-1–5 MUT and pmaxGFP (inset). Fixed, nonpermeabilized microVSM or HEK293 cells were stained with anti-HA mouse monoclonal antibody followed by secondary Alexa Fluor-568 goat anti-mouse IgG (red), and nuclear stain Hoechst (blue). Arrows point to surface immunofluorescence staining in GFP positive human microVSM and HEK 293 cells. Scale bars = 20 μm. G: relative cell surface HA-α2C-AR-1–5 MUT receptors (mean fluorescence intensity) in human microVSM treated with the Epac-Rap1 activator 8-pCPT-2′-O-Me-cAMP (100 μM, for various time intervals in minutes: 0, 30, 60, 90, 120, 180, 360, and 540). Quantitation of mean fluorescence intensity of cell surface α2C-ARs was assessed at 4 different regions of the cell boundary per cell. Data from 8–10 GFP positive cells per interval are shown, *P < 0.05, ***P < 0.001. H: relative cell surface HA-α2C-AR WT receptors (mean fluorescence intensity) in human microVSM treated with the Epac-Rap1 activator 8-pCPT-2′-O-Me-cAMP (100 μM, for various time intervals in minutes: 0, 30, 60, 90, 120, 180, 360, and 540), and control nonsilencing RNA. Quantitation of mean fluorescence intensity of cell surface α2C-ARs was assessed at four different regions of the cell boundary per cell. Data from 7–10 GFP-positive cells per interval are shown, *P < 0.05, ***P < 0.001. I: relative cell surface HA-α2C-AR WT receptors (mean fluorescence intensity) in human microVSM treated with the Epac-Rap1 activator 8-pCPT-2′-O-Me-cAMP (100 μM, for various time intervals in minutes: 0, 30, 60, 90, 120, 180, 360, and 540), and filamin-2 siRNA (FLN2). Quantitation of mean fluorescence intensity of cell surface α2C-ARs was assessed at four different regions of the cell boundary per cell. Data from 7–12 GFP positive cells per interval are shown, *P < 0.05, ***P < 0.001. J: effect of filamin-2 (FLN-2) knockdown on human microVSM α2C-AR function. Quiescent cells [48 h after delivery of control nonsilencing (i) or FLN-2 siRNA (ii)] were treated with 8-pCPT-2′-O-Me-cAMP (100 μM, 14 h). Receptor function was assessed by ability to inhibit forskolin (FSK) stimulated intracellular cyclic AMP accumulation in response to the α2-AR agonist UK 14,304 (UK, 10 pM - 10 nM). Basal level of cyclic AMP was elevated by FSK (5 μM, 5 min). Data are corrected for the baseline value and are presented as a percentage of the response to FSK alone and are expressed as means ± SE for n = 2–3 independent experiments measured in duplicate; *P < 0.05, ****P < 0.0001. The α2C-AR function in cells with FLN-2 siRNA is impaired, consistent with the role of F-actin-filamin in receptor translocation.

