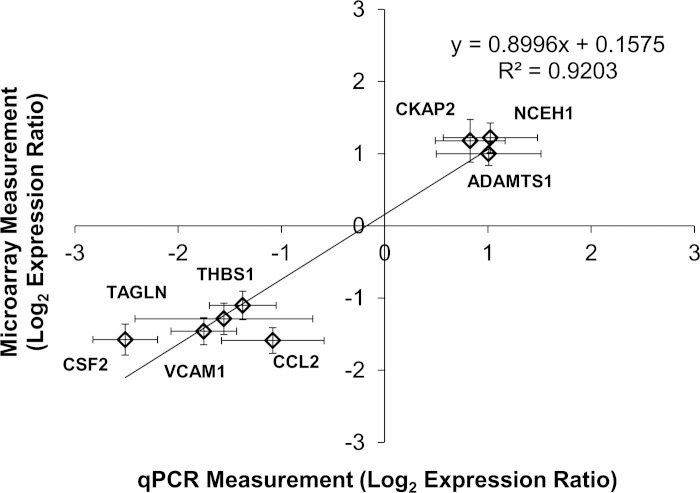
Fig. 2.
Quantitative (q)PCR validation of microarray results. The log2 expression ratios between positive WSSG and negative WSSG were measured by qPCR analysis for 8 selected genes and compared with log2 expression ratios obtained by microarray analysis. Each diamond represents data for 1 gene, as indicated. Line represents the least squares fit to the data (correlation coefficient R2 = 0.9203; P < 0.0002 by linear regression). Error bars are means ± SE; n = 3.

