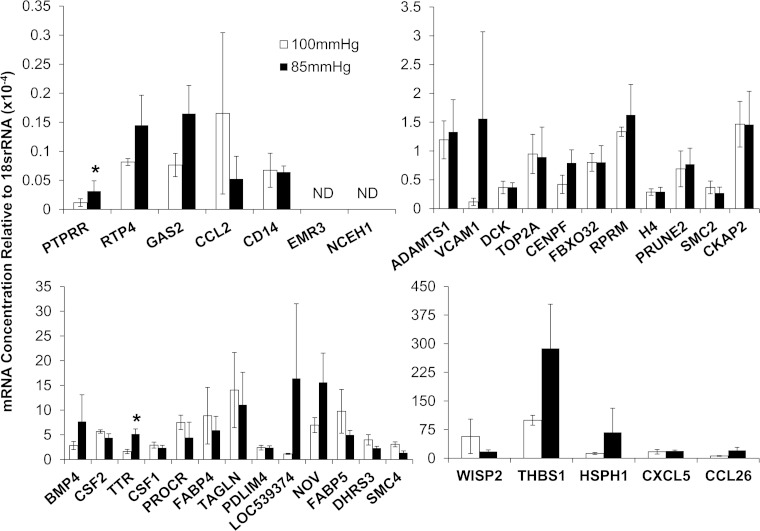
Fig. 3.
Endothelial cell (EC) gene expression of cells experiencing uniform WSS of 3.5 Pa at 2 different hydrostatic pressures, 100 mmHg (open bars) and 85 mmHg (solid bars), in the 2 uniform segments at the entrance and exit of the flow chamber (sections a and e, respectively). Gene expression was assayed with qPCR, and only 2 genes (TTR and PTPRR) had statistically significant differences in expression (*P < 0.05, paired t-test,). Error bars are means ± SE; n = 3. ND, transcripts expressed at nondetectable levels.

