Fig. 5.
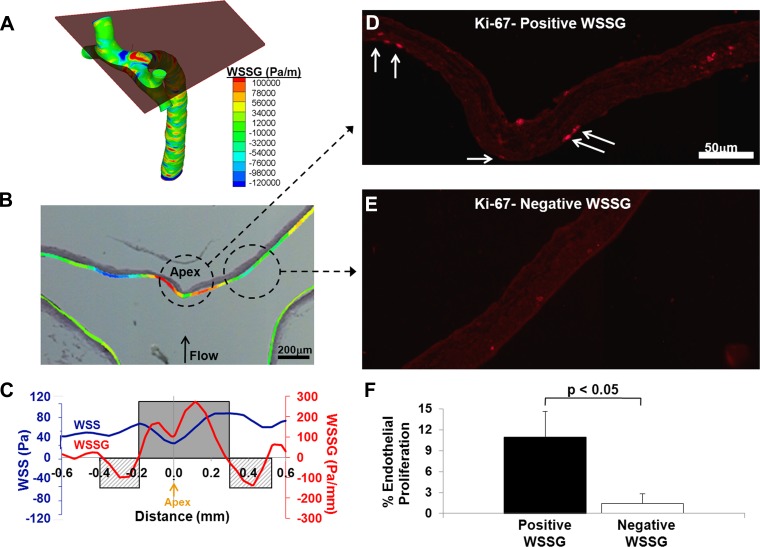
EC proliferation in the rabbit basilar terminus is colocalized with positive WSSG. A: 3-dimensional WSSG distribution in the basilar bifurcation from computational fluid dynamics for a rabbit 5 days after bilateral carotid artery ligation. The plane equivalent to the plane of sectioning for the histology shown in B–E is indicated. B: overlay of the WSSG distribution from the plane in A on the image of the corresponding histological section stained with Van Gieson stain. C: plot of WSS (blue) and WSSG (red) vs. distance from the apex along the luminal surface in the cutting plane used for B–E. Regions of positive WSSG (shaded) and negative WSSG (cross-hatched) are indicated. D: representative immunofluorescent staining for Ki-67 in a region under positive WSSG, 5 days after carotid ligation. Ki-67 staining of ECs is seen along the luminal surface (arrows). E: representative staining from the negative WSSG in the same animal. F: percentage of proliferating ECs under positive and negative WSSG was scored in 5 animals. Bars indicate the average percentage ± SE; the percentage was significantly different between positive and negative WSSG (paired t-test, P < 0.05).

