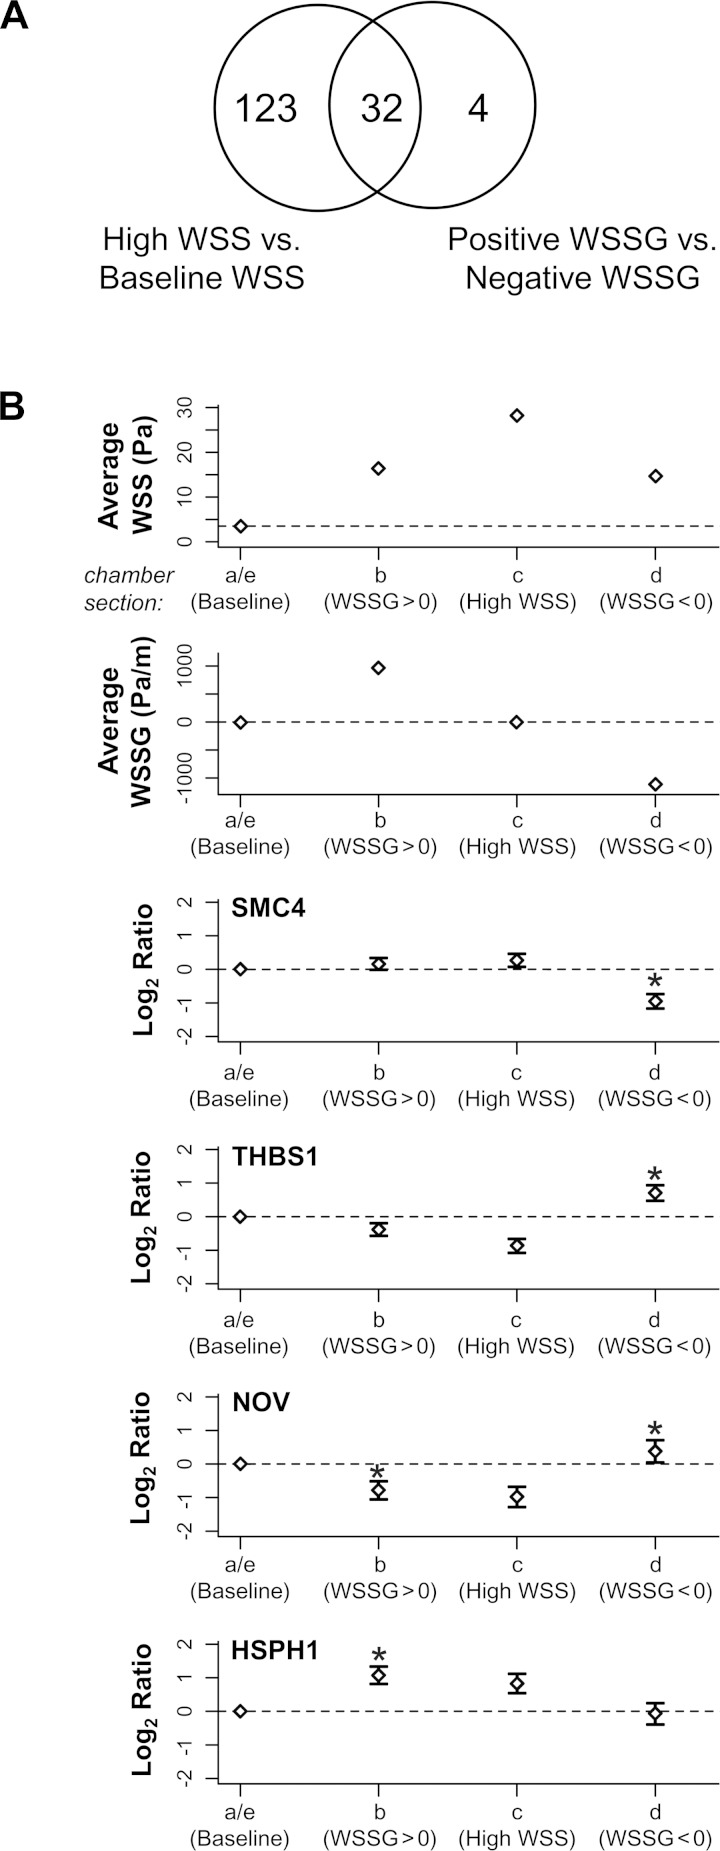
Fig. 7.
Expression of 4 WSSG-sensitive genes that are relatively insensitive to WSS in the absence of gradient. A: Venn diagram shows the number of genes overlapping between 2 comparisons: high WSS of 28.4 Pa vs. baseline WSS of 3.5 Pa and positive WSSG vs. negative WSSG. Four genes, SMC4, HSPH1, THBS1, and NOV, are differentially expressed between positive and negative WSSG but are not significantly different (2-fold difference in expression intensities at 5% FDR) between high WSS and baseline WSS. B: expression ratios in positive WSSG (chamber, b), high WSS (c), and negative WSSG (d) were each compared with baseline WSS with WSSG = 0 (a and e; baseline levels are indicated across each panel by a dotted line). Negative WSSG significantly downregulated SMC4 and upregulated THBS1 and NOV compared with baseline WSS. The direction in which expression of SMC4, THBS1, and NOV was altered by negative WSSG was opposite to the change effected by high WSS. Positive WSSG significantly downregulated NOV and upregulated HSPH1 relative to baseline WSS, although their expression under positive WSSG was not significantly different between positive WSSG or high WSS. Each bar represents the mean intensity ± SE from 3 biological replicates. *Indicates ≥2-fold difference in expression at 5% FDR from baseline WSS.

