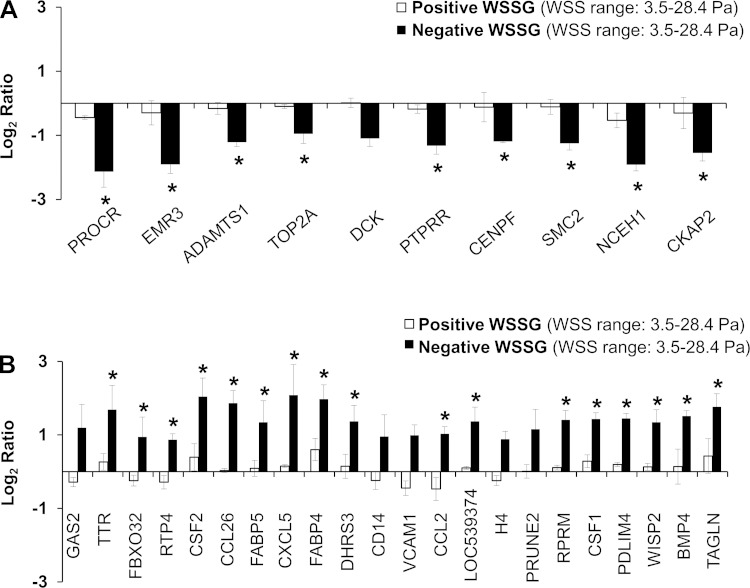
Fig. 9.
Gene expression is affected differently by positive WSSG and negative WSSG relative to WSS = 28.4 Pa and zero gradient. A: expression under negative WSSG (solid bars) and positive WSSG (open bars) was compared with high WSS (28.4 Pa) with WSSG = 0 for all 10 WSSG-sensitive genes that were also upregulated by high WSS. Note that expression under negative WSSG was significantly different from expression in high WSS for all genes except 1, DCK, yet expression in positive WSSG was not significantly higher than high WSS for any of the 10 genes. B: same comparisons were made for the 22 WSSG-sensitive genes that were downregulated by high WSS. Expression under negative WSSG was significantly different from the high WSS for all of the genes except GAS2, CD14, VCAM1, H4, and PRUNE2. In contrast, expression under positive WSSG was not significantly different from expression in high WSS for any of the 22 genes. Each bar represents the mean intensity ± SE from 3 flow experiments. *Expression difference relative to high WSS of 28.4 Pa was ≥2-fold at 5% FDR.

