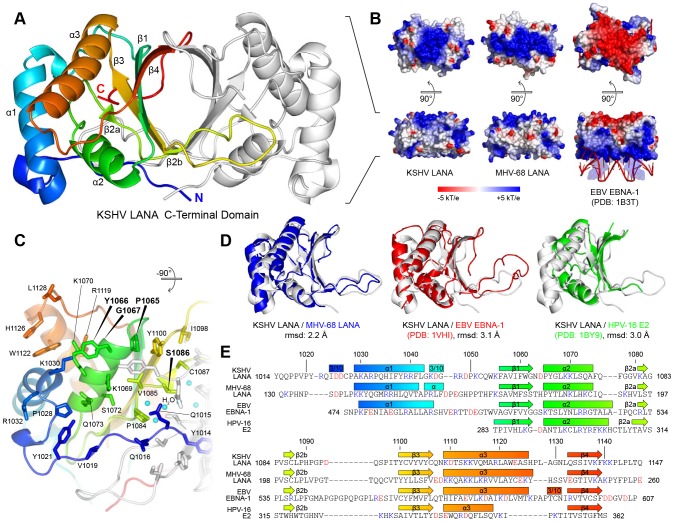
Figure 1. Crystal Structure of the KSHV LANA CTD with Its Orthologs.
A: Crystal structure of the dimeric kLANA CTD, front view. B: Surface electrostatic potential of kLANA, mLANA, and the EBV EBNA-1 CTD in front view (bottom) and top view (above). Red represents negative charge and blue represents positive charge. C: Residues at the sequence specific DNA binding site of kLANA, bottom view. Residues mutated in this study are bold faced. D: 3D superpositions of the kLANA CTD (white) with mLANA (blue), EBV EBNA-1 (red), and HPV-16 E2 (green) CTD monomers. E: Structure-based sequence alignment of kLANA, mLANA, EBV EBNA-1, and HPV-16 E2 CTDs. Acidic residues are red and basic residues are blue. See also Figure S1.

