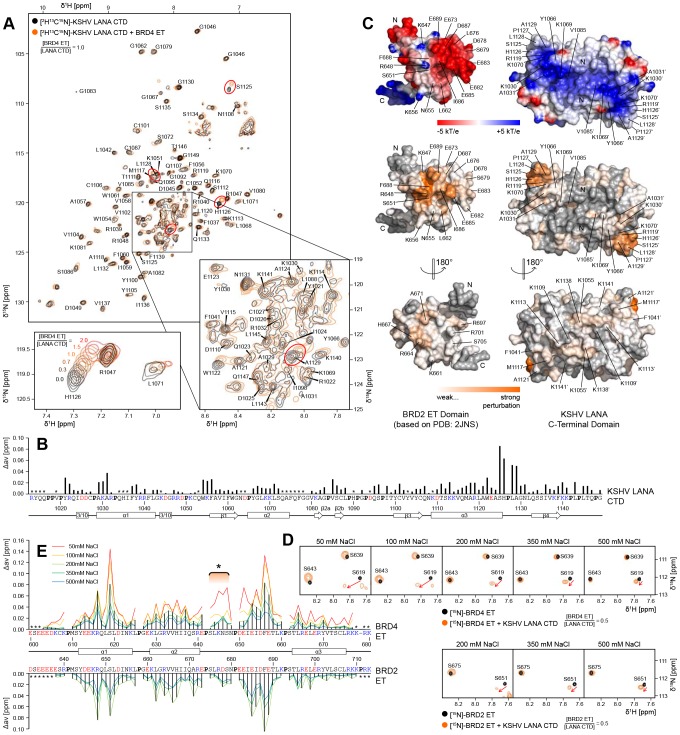
Figure 3. Interaction of the KSHV LANA CTD with ET Domains in Solution.
A: [1H,15N]-TROSY spectra of 0.48 mM [2H,13C,15N]-kLANA(1013–1149) in 30 mM NaCl in the absence (black) and presence (orange) of 0.48 mM unlabeled BRD4(600–680). Prominent chemical shift perturbations are encircled in red. Bottom left: Chemical shift perturbation of H1126 upon titration of BRD4 ET. Bottom right: Backbone amide assignment of the central spectral region. B: Magnitude of chemical shift perturbations from (A) over the sequence of kLANA(1013–1149). Unassigned residues are indicated (*). Acidic residues are red and basic residues are blue, prolines are in bold face. C: Top: Surface electrostatic potential of BRD2 ET (left) and the kLANA CTD in bottom view (right). Below: Chemical shift perturbations mapped on the structures of BRD2 ET (200 mM NaCl) and the kLANA CTD (30 mM NaCl). Prolines and other unassigned residues are grey. D: Details of [1H,15N]-TROSY spectra of 0.48 mM 15N-BRD4(600–680) (top) and 15N-BRD2(632–713) (bottom) at different NaCl concentrations in the absence (black) and presence (orange) of 0.96 mM unlabeled kLANA(996–1153). Perturbation of S619 (BRD4) and S651 (BRD2) is indicated by an arrow. E: Magnitude of chemical shift perturbations from (D) over an alignment of BRD4 (top) and BRD2 (bottom) ET domains at different NaCl concentrations. Histogram bars are given for 200 mM NaCl. A region of strong chemical shift perturbation only at 50 mM NaCl is indicated (*); compare Figure 4D.

