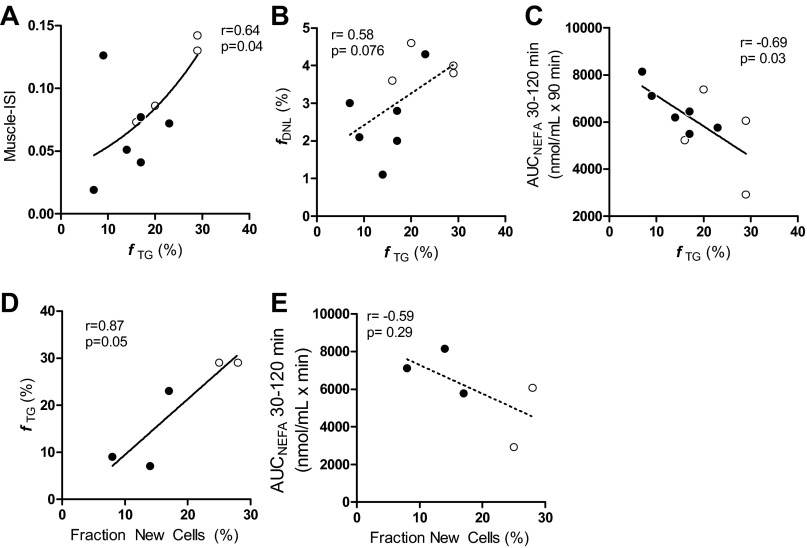
Fig. 3.
Open and closed circles represent data from obese without and with the metabolic syndrome, respectively. Correlation analysis was performed using the linear regression model. A: greater insulin sensitivity (Muscle-ISI) correlates with higher fTG (%); Muscle-ISI is an OGTT-derived index of peripheral (or muscle) insulin resistance (27) and was log transformed for the skewed distribution. Increasing subcutaneous abdominal adipocyte TG synthesis (fTG, %) tended to be associated with increasing DNL (fDNL, %; B), and was significantly associated with lower plasma NEFA levels (C) during the hyperinsulinemic phase of the OGTT (AUCNEFA; better insulin-mediated NEFA suppression). D: adipocyte proliferation (fraction new cells, %) was positively correlated with fTG (%) in subcutaneous abdominal adipose tissue. E: trend was observed between increasing adipocyte proliferation (fraction new cells, %) and decreasing plasma NEFA during peak hyperinsulinemia (better adipocyte insulin sensitivity).

