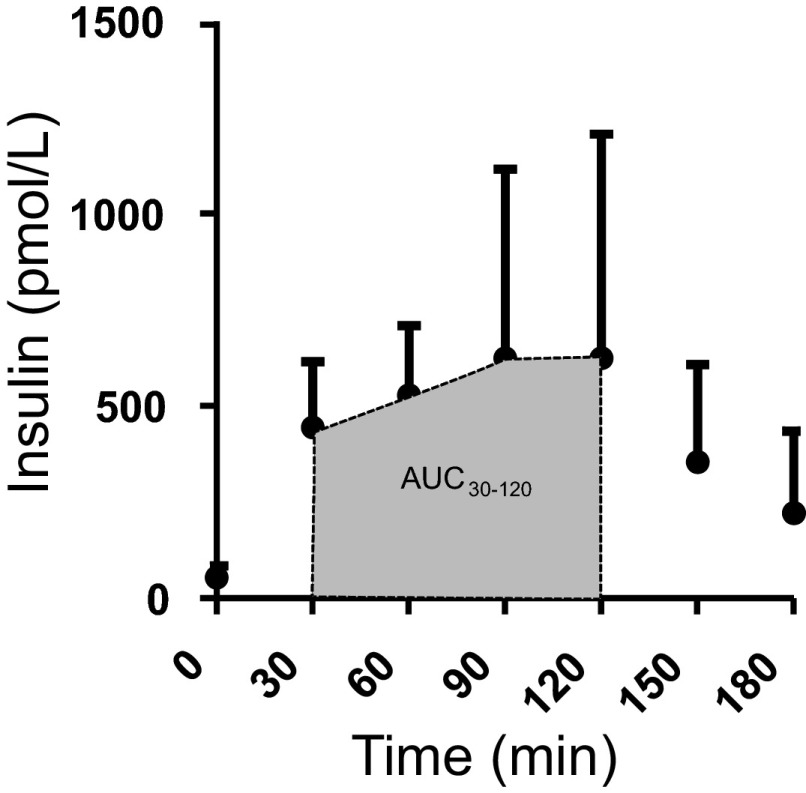
Fig. 4.
Plasma insulin concentrations during standard OGTT are reported at each time point from 75-g glucose ingestion. Shaded area represents the hyperinsulinemic phase of the OGTT. Based on this information, the interval 30–120 min was used to calculate the area under the curve for plasma NEFA (AUCNEFA) as a measure of insulin-mediated NEFA suppression.

