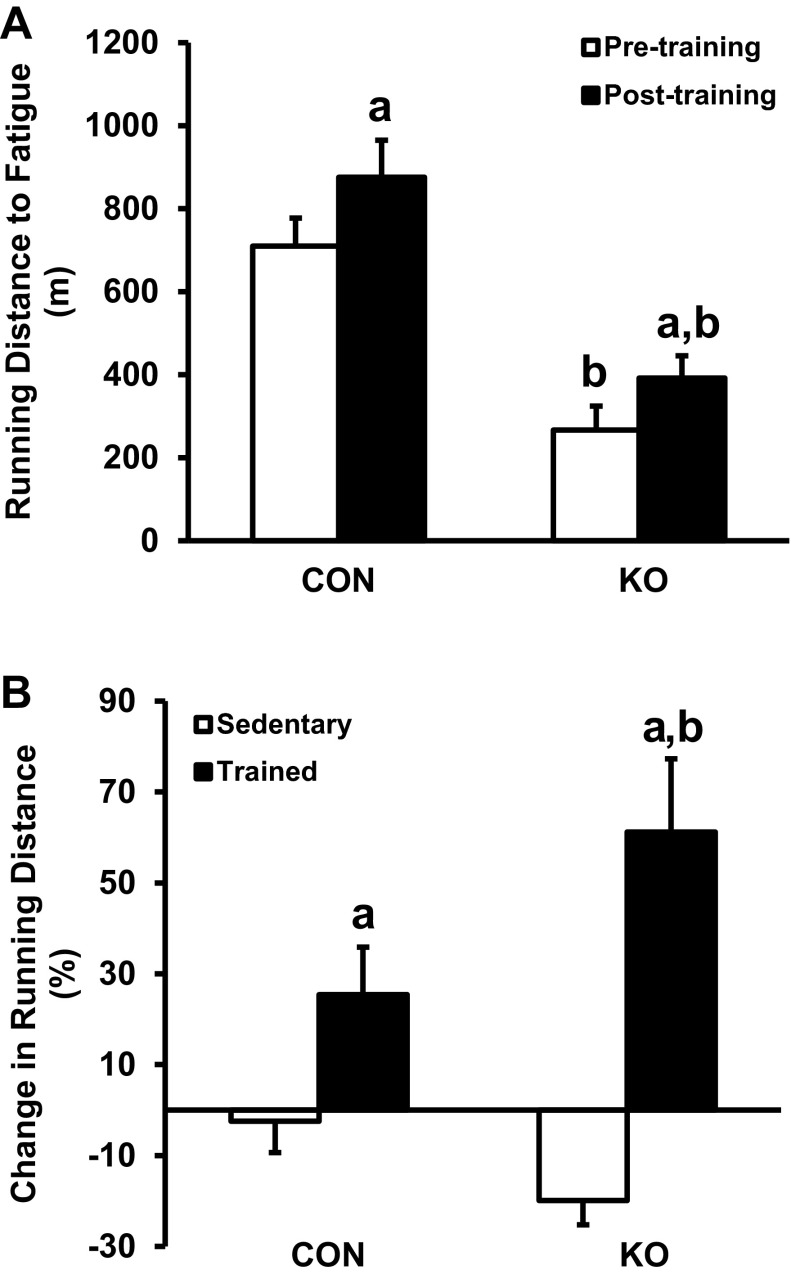
Fig. 4.
Maximal treadmill running capacity of CON and skmLKB1-KO mice before and after 3 wk of treadmill run training. A: total running distance to fatigue during a progressive treadmill testing protocol before and after treadmill training. B: %change in running distance to fatigue from pretesting to posttesting in sedentary and trained mice. Data are presented as means ± SE (n = 8–9). aP < 0.05 vs. corresponding pretraining (A) or sedentary mice (B); bP < 0.05 vs. corresponding CON mice.

