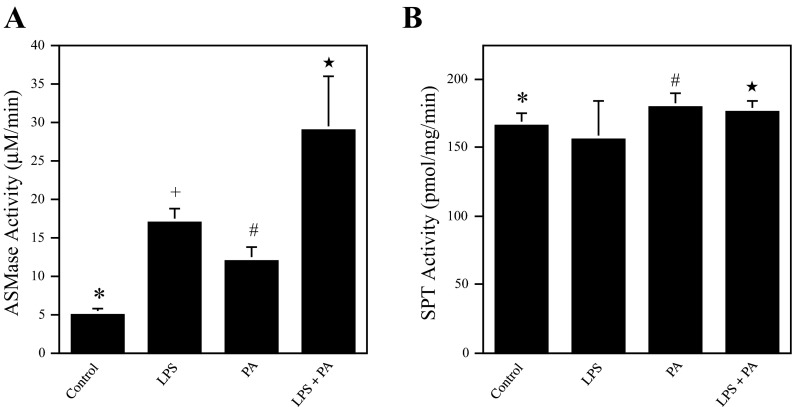
Fig. 7.
The effect of LPS, PA, or LPS and PA on ASMase activity (A) and serine palmitoyl-CoA transferase (SPT) activity (B). Bars with different symbols in the bar graphs have significantly different values. A: RAW 264.7 cells were treated with 1 ng/ml LPS, 100 μM PA, or LPS and PA for 4 h. After the treatment, cells were lysed and cell lysates used for ASMase activity assay. * and +, #, or ★P < 0.01; ★ and + or #P < 0.01. B: RAW 264.7 cells were treated with 1 ng/ml LPS, 100 μM PA, or LPS and PA for 4 h. After the treatment, cells were collected for SPT activity assay. * and # or ★P < 0.05.

