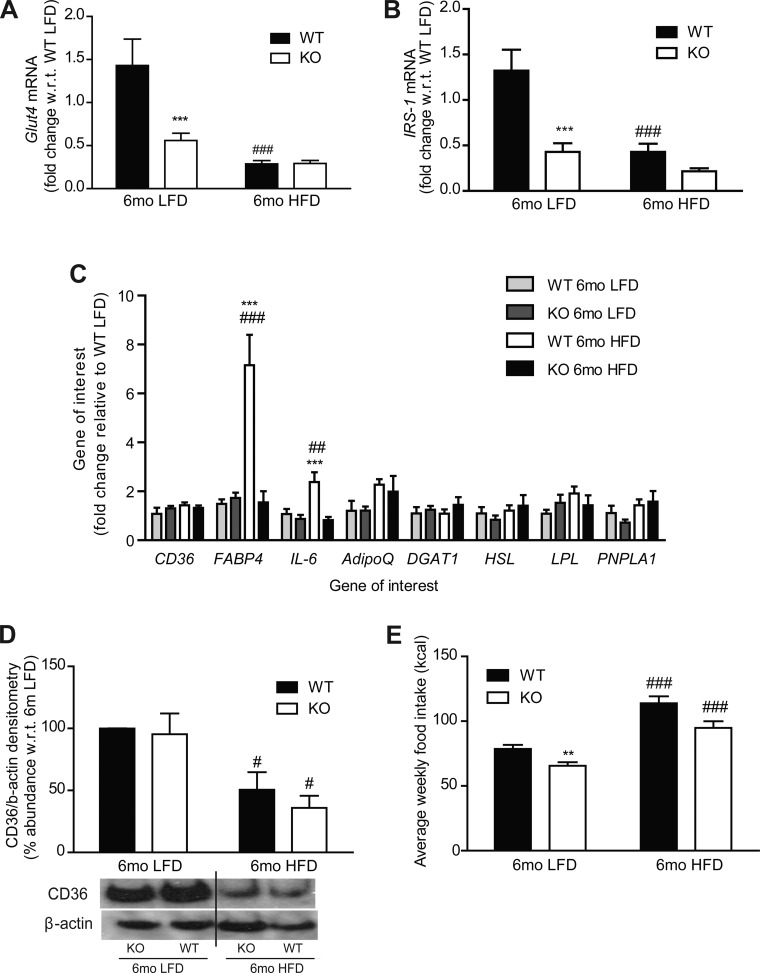
Fig. 4.
Adipose gene and protein expression analysis after 6 mo LFD and HFD in WT and IL-1RI−/− mice. A–C: adipose tissue RNA was harvested, and mRNA levels of Glut4 (A), insulin receptor substrate (IRS)-1 (B), CD36 (C), fatty acid-binding protein (FABP)-4, IL-6, diglyceride acyltransferase (DGAT), adiponectin (adipoQ), lipoprotein lipase (LPL), hormone sensitive lipase (HSL), and patatin-like phospholipase domain containing 1 (PNPLA1) were measured by real-time PCR (***P < 0.001, WT vs. KO; ##P < 0.01 and ###P < 0.001, LFD vs. HFD, n = 4–8). D: protein levels of CD36 and β-actin loading control were measured in adipose by immunoblot analysis; representative blot and densitometry analysis are shown (#P < 0.05, LFD vs. HFD, n = 3). E: average weekly caloric intake per mouse on LFD and HFD (**P < 0.01, WT vs. KO; ###P < 0.001, LFD vs. HFD). Intake measured weekly and averaged over 6 wk (HFD) or 25 wk (LFD), n = 3 cages/group.

