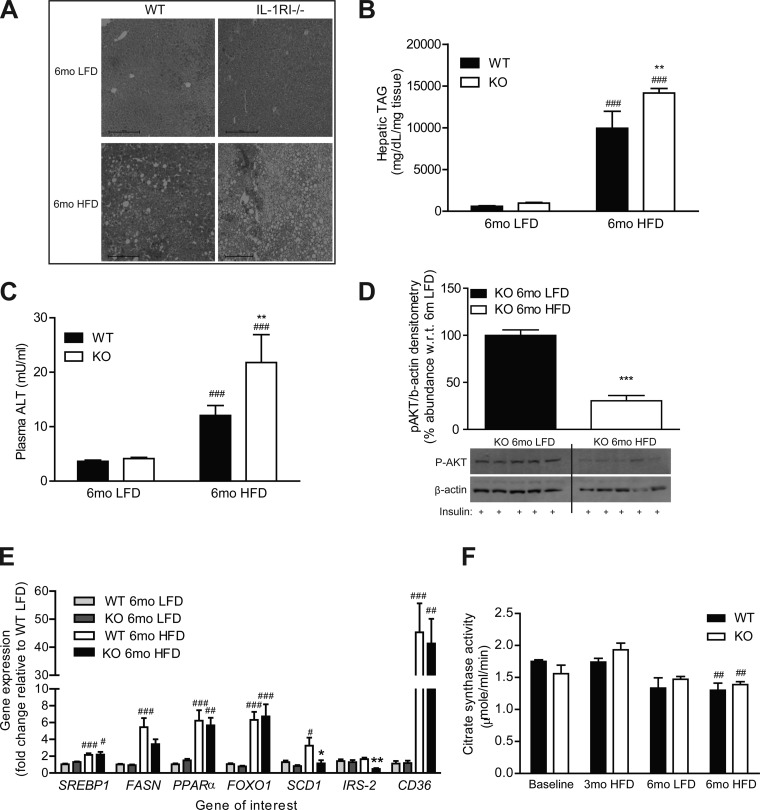
Fig. 5.
Characterization of hepatic lipotoxicity and insulin sensitivity after 6 mo intervention with either LFD or HFD. A: liver morphology of WT and IL-1RI−/− mice was monitored after 6 mo LFD and HFD by H&E staining. B: liver triacylglyceride (TAG) levels were quantified enzymatically (n = 8). C: plasma alanine aminotransferase (ALT) levels were monitored by ELISA (n = 5–14). D: mice were injected ip ± insulin (1.5 U/kg) and were killed after 15 min. Insulin-induced phosphorylation of AKT in liver protein samples was analyzed by immunoblotting, and densitometry was calculated relative to β-actin loading control (n = 10–13). Representative blot presented. E: liver mRNA was isolated and reverse transcribed before real-time PCR analysis of lipogenic genes (n = 12–14). 18S was used as an internal control, and genes are expressed relative to 6 mo WT LFD group. F: citrate synthase activity was monitored in WT and IL-1RI−/− liver lysates after LFD or HFD and compared with baseline levels as a biomarker of mitochondrial function (n = 6). Statistics: #P < 0.05, ##P < 0.01, and ###P < 0.001, LFD vs. HFD; *P < 0.05, **P < 0.01, and ***P < 0.001, WT vs. KO.

