
Fig. 1.
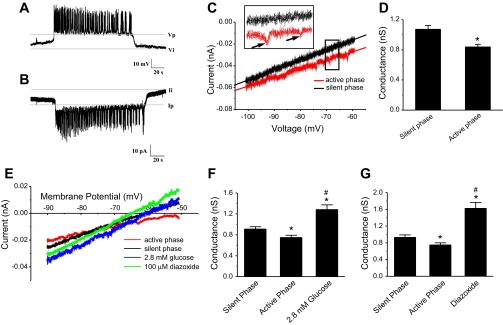
Recordings of peripheral islet cells in current clamp and voltage clamp and slope conductances measured under different conditions. A: patch-clamped cells in current-clamp mode were identified as β-cells by their characteristic bursting pattern. B: when the recording mode was switched to voltage clamp, inverted current bursts were seen, reflecting current from neighboring cells entering via gap junctions. The ratio of voltage differential to current differential yields an estimate of 1 nS coupling for the islet shown; the mean for 15 islets was 0.96 ± 0.01 nS. C: interrupted voltage ramp (IVR) protocol was used to generate current-voltage (I-V) curves in which the potential of the clamped cell was ramped from −100 to −60 mV. Invading action currents were taken as an indication that the rest of the islet was in its active phase (red); silent-phase trace indicated in black. Slope was estimated by linear curve fitting. D: in the presence of 11.1 mM glucose, conductance in the active phase was reduced compared with the silent phase (active-phase) conductance. E: representative I-V recording traces during voltage ramps. Voltage ramps were applied to islets exposed to saline containing 2.8 mM glucose or in the presence of 100 μM diazoxide in saline containing 11.1 mM glucose. Different slopes indicate that conductance is different under these conditions. F: islets exposed to 2.8 mM glucose have higher conductance than silent or active phases of islets in 11.1 mM glucose. G: conductance in the presence of diazoxide is higher than in silent or active phases in 11.1 mM glucose. *Significant difference from active phase; #significant difference from silent phase.