Fig. 4.
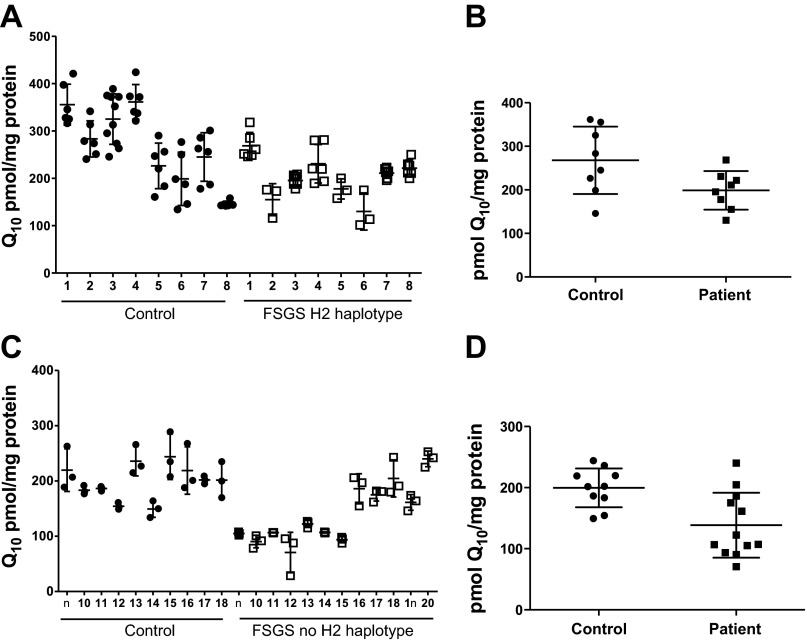
Q10 content in LCLs from focal segmental glomerulosclerosis (FSGS) patients is decreased relative to that of controls. A: total Q10 content for each LCL derived from control subjects or patients. FSGS patients are the 8 individuals who were homozygous for the H2/H2 haplotype. Q10 content is presented as a scatter plot, with average ± SD denoted by 3 horizontal lines (n = 6, except n = 10 for control sample 3 and n = 3 for FSGS samples 2, 5, and 6). B: Q10 content of FSGS patients' cell lines (n = 8, 198.8 ± 44.2 pmol/mg protein) is significantly decreased compared with Q10 content of control cell lines (n = 8, 267.7 ± 77.3 pmol/mg protein). Each of the average values from A is represented as a scatter plot, with average ± SD denoted by 3 horizontal lines. P < 0.05 was determined by Student's 2-tailed t-test. C: total Q10 content for each LCL derived from 10 additional control subjects and 12 FSGS patients. FSGS patients did not have the H2/H2 genotype. Q10 content is presented as described in A (n = 3). D: Q10 content of FSGS patients' cell lines (n = 10, 138.6 ± 53.2 pmol/mg protein) is significantly decreased compared with Q10 content of control cell lines (n = 12, 199.6 ± 31.8 pmol/mg protein). Each of the average values from C is represented in a scatter plot, with average ± SD denoted by 3 horizontal lines. P < 0.005 was determined by Student's 2-tailed t-test.

