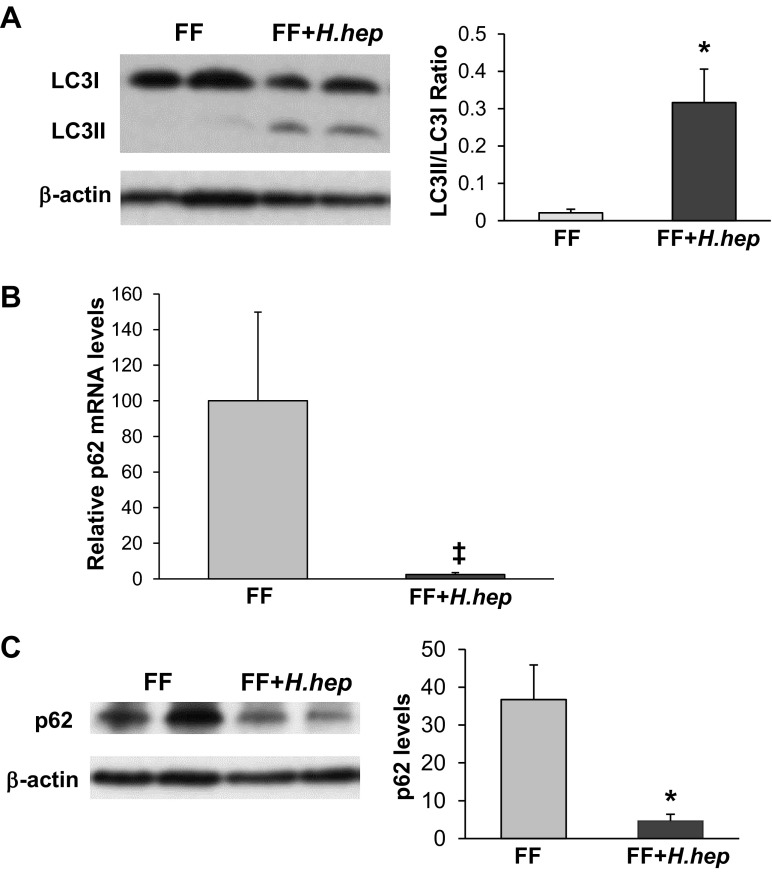
Fig. 6.
Effect of H. hepaticus on expression of LC3II and p62 proteins. A: left, representative LC3 bands from Western blot analyses are shown for the FF and FF+H.hep groups. Conjugation from LC3I (17 kDa) into the LC3II (15 kDa), an autophagosomal membrane-incorporated isoform, is observed in the FF+H.hep group. Right, densitometry quantification of Western blot analysis for LC3 presented as a ratio of LC3II/LC3I (n = 7; *P ≤ 0.01 vs. FF). B: p62 mRNA levels evaluated using real-time PCR. The mean steady-state mRNA level for the FF group was assigned a value of 1.0, and mean mRNA level for the FF+H.hep group was determined relative to this number. Values are means ± SE; n = 14–16 animals/experimental group. ‡P ≤ 0.02 vs. FF. C: left, representative p62 (62-kDa) bands from Western blot analyses are shown for the FF and FF+H.hep groups. Right, densitometric values were normalized to β-actin and to FF value (n = 7; *P ≤ 0.01 vs. FF).

